Transcriptional responses indicate acclimation to prolonged deoxygenation in the coral Stylophora pistillata
 Hagit Kvitt1,2
  Assaf Malik1
  Smadar Ben-Tabou de-Leon1
  Eli Shemesh1
  Maya Lalzar3
  David F. Gruber4 Hanna Rosenfeld2
  Tuo Shi5
  Tali Mass1
  Dan Tchernov1*
- 1Department of Marine Biology, The Leon H. Charney School of Marine Sciences, University of Haifa, Haifa, Israel
- 2Israel Oceanographic and Limnological Research, National Center for Mariculture, Eilat, Israel
- 3Bioinformatics Services Unit, University of Haifa, Haifa, Israel
- 4Department of Natural Sciences, City University of New York, Baruch College, New York, NY, United States
- 5Marine Genomics and Biotechnology Program, Institute of Marine Science and Technology, Shandong University, Qingdao, China
The current decrease in oceanic dissolved oxygen is a widespread and pressing problem that raises concern as to how marine biota in general, and coral reefs in particular will be affected. However, the molecular response underlying tolerance of corals to prolonged severe deoxygenation where acclimation to hypoxia can accrue is not yet known. Here, we investigated the effect of two weeks of continuous exposure to conditions of extreme deoxygenation, not hitherto exerted under laboratory conditions (~ 0.35 mg L−1 dissolved oxygen), on the physiology and the diurnal gene expression of the coral, Stylophora pistillata. Deoxygenation had no physiologically significant effect on tissue loss, calcification rates, symbiont numbers, symbiont chlorophyll-a content and symbiont photosynthesis rate. However, deoxygenation evoked a significant transcriptional response that was much stronger at night, showing an acute early response followed by acclimation after two weeks. Acclimation included increased mitochondria DNA copy numbers, possibly increasing energy production. Gene expression indicated that the uptake of symbiosis-derived components was increased together with a decrease in nematocyst formation, suggesting that prolonged deoxygenation could enhance the corals’ need for symbiosis-derived components and reduces its predation abilities. Coral orthologs of the conserved hypoxia pathway, including oxygen sensors, hypoxia-inducible factor (HIF) and its target genes were differentially expressed in a similar temporal sequence as observed in other metazoans including other species of corals. Overall, our studies show that by utilizing highly conserved and coral–specific response mechanisms, S. pistillata can acclimate to deoxygenation and possibly survive under climate change-driven oceanic deoxygenation. On the other hand, the critical importance of algal symbionts in this acclimation suggests that any environmental perturbations that disrupt such symbiosis might negatively affect the ability of corals to withstand ocean oxygen depletion.
Introduction
The current decrease in oceanic dissolved oxygen, derived by ocean warming and coastal eutrophication, is amongst the most widespread and pressing problems in marine environments (Schmidtko et al., 2017; Hughes et al., 2020). Ocean models predict declines of 1% to 7% in the global ocean O2 inventory, relative to current levels, by the year 2100 (Keeling et al., 2010). Indeed, severe hypoxic “dead zones” of coastal waters are rapidly increasing in prevalence worldwide, raising concern as to how marine biota in general, and coral reefs in particular will be affected (Altieri et al., 2017).
Shifts in coral community structure were documented following a severe hypoxic event on a coral reef in the Caribbean coast of Panama. Hypoxia was confirmed by water-quality surveys, detecting very low concentrations (<0.5 mg L-1) of dissolved oxygen (DO) near the bottom (at a depth >10 m) (Altieri et al., 2017). Subsequent laboratory experiments exposing two coral species from that site to one week of deoxygenation (0.5 mg L-1 DO) combined with thermal stress showed that both species survived the thermal stress but only one species survived thermal stress and deoxygenation. This suggests that hypoxia, not thermal stress, was the main cause of coral mortality observed in affected sites and that some coral species can withstand oceanic hypoxia (Altieri et al., 2017). The differential susceptibility of corals to deoxygenation was confirmed by exposing two coral species to three conditions of deoxygenation (1.0, 2.25 and 4.25 mg L−1 DO) (Johnson et al., 2021b). This study revealed that levels of DO as low as 2.25 mg L−1 elicited minimal physiological responses in both species with regard to bleaching, survival and photophysiology of algal symbionts (hereinafter referred to as “symbionts”), suggesting that corals can withstand levels of oxygen depletion that are lethal to many other marine organisms. However, at 1.0 mg L−1 DO one species exhibited significant physiological responses including mortality at two to five days, whereas the other species remained almost unaffected after 11 days of treatment. A similar study on two Red Sea coral species exposed to three DO levels for 10 days also reported that only DO levels of 1.25 mg L−1 elicited a decline in physiological parameters (i.e., bleaching, respiration, photophysiology and chlorophyll content of symbionts). These responses differed among the two coral species, with one species showing higher resistance to deoxygenation (Alva García et al., 2022). These results emphasize the variability in species-specific hypoxia thresholds (Johnson et al., 2021b) (Alva García et al., 2022), possibly governed by the genetic make-up of the species, that could include different gene copy numbers and/or differential gene expression response.
Across Metazoa, responses to low-oxygen levels are mediated by the heterodimeric transcription factor HIF (hypoxia-inducible factor), consisting of a hypoxia-regulated HIF-α subunit and a constitutively expressed HIF-β subunit (Figure S1). Under normoxia, HIF-α protein is marked for degradation by prolyl 4-hydroxylases (PHDs) (Mircea and William, 2017). Under hypoxia, the PHDs are down-regulated and HIF-α can associate with its co-factor, HIF-β (Figure S1). HIF directly activates the transcription of a conserved core set of target genes, collectivly termed “conserved core hypoxia signatures”, that enable cells to rapidly survive hypoxia by multiple ways: (i) enhancing oxygen-independent ATP production via glycolysis, (ii) adjusting mitochondrial activity and dynamics, (iii) controlling hypoxia-induced apoptosis/mitophagy, and (iv) in animals with blood vessels, increasing oxygen and nutrient supply via blood vessel formation (Shaw, 2008; Lendahl et al., 2009; Fuhrmann and Brüne, 2017). Thus, by stabilization of HIF-α and altering specific gene expression cells can survive hypoxia.
The HIF genes are highly conserved across Metazoa and had apparently arose from a series of duplications from a single gene, that also gave rise to key circadian-rhythm clock-genes (Mills et al., 2018). Clock genes serve as the basis for an intracellular timekeeping system, which generates circadian rhythms of approximatly 24 hours in physiology and behaviour (e.g., (Takahashi, 2017)). The ancestral HIF and clock genes originated in Eumetazoa evolved from unicellular organisms, and are present in basal diploblastic eumetazoans, including corals, and all triploblastic eumetazoans (Mills et al., 2018). In mammalians, daily oxygen rhythms affect the circadian clock, possibly through interactions of HIF1-α with clock genes (Adamovich et al., 2017). Also, hypoxia affects the expression of clock genes in different tissues (Manella et al., 2020), suggesting a functional link between oxygen and circadian rhythm sensing. Overall, there are evolutionary and functional connections between the HIF-mediated hypoxia pathway and the circadian-rhythm clock genes in metazoans.
Scleractinian corals are a unique model to investigate the molecular response to hypoxic conditions and its relation to the diurnal cycle due to their association and co-evolution with photosynthetic symbionts (from here on referred to as symbionts) (Stanley and Helmle, 2010). This association presents corals with hyperoxic conditions at daytime (when photosynthesis occurs) and hypoxic conditions at night (when both coral and symbionts are respiring) (Kühl et al., 1995). Indeed, diurnal night-time up-regulation of HIF expression was reported in corals, and was linked to the photophysiology of the symbionts (Levy et al., 2011). Therefore, sensing and responding to diurnal changes in oxygen levels is crucial in corals, tightly linking hypoxia to the circadian rhythm. Yet little is known about long-term hypoxia-induced diurnal transcriptional response in corals and the possible coupling between the circadian rhythm and HIF genes.
The hypoxia pathway was suggested to be evolutionary conserved in Cnidaria (Wang et al., 2014; Zoccola et al., 2017; Alderdice et al., 2020). Their studies show that under hypoxia the HIF-1α protein is stabilized (Wang et al., 2014) and the protein level is increased (Zoccola et al., 2017). Indeed, exposure of corals to 12 hours of mild deoxygenation (2 mg O2 L-1) at night-time leads to the transcriptional up-regulation of hypoxia-related genes (Alderdice et al., 2020). These response genes include HIF-α and some of HIF target genes, such as metabolic genes promoting glycolysis, lipid uptake and mitophagy/apoptosis genes; demonstrating that corals possess a complete and active HIF-mediated hypoxia response system analogous to that of other metazoans (Alderdice et al., 2020). Additionally, gene expression suggested that short-term hypoxia-induced stress response includes reduction in mitochondria formation and electron transport to the electron transport chain (ETC), as well as up-regulation of cell death/apoptosis. Similarly, exposure of coral larvae to 12 hours of deoxygenation (~2 mg O2 L-1), reported differential gene expression of some HIF target genes, and of genes termed in that study “non-HIF-targeted hypoxia stress genes”. Gene expression suggested a disruption of pathways involved in developmental regulation, mitochondrial activity, lipid metabolism, and O2-sensitive epigenetic regulators (Alderdice et al., 2021). These studies emphasize the effect of short-term deoxygenation on different life stages of corals (Alderdice et al., 2020; Alderdice et al., 2021), and the need to investigate mechanisms of long-term deoxygenation tolerance. Also, mechanisms of short-term hypoxia tolerance were suggested to be also involved in thermal stress tolerance and bleaching (Alderdice et al., 2020), implying that some coral species are better adapted than others not only to hypoxia (Johnson et al., 2021b), (Alderdice et al., 2020) but also to additional environmental perturbations.
In order to assess if gene copy number differences can account for the variability in inferred stress tolerance, an ortholog-based meta-analysis study was done (Alderdice et al., 2022a). This study compiled a list of 32 hypoxia-associated genes, based on genes previously implicated in the hypoxia response and heat stress response of corals, or associated with hypoxia in other model organisms, including some direct HIF target genes. Putative homologs were identified in sequenced genomes of 24 coral species. Most species possessed copies for key hypoxia response genes. However, for most genes (20 out of 32) there were minimal predicted gene expansions or none at all. Genes that did exhibit differences in copy numbers were species-specific, and except for one coral species, they could not be associated to hypoxia or thermal stress tolerance. Interestingly, two coral species, namely Acropora selago and Acropora tenuis did not differ in gene copy numbers (see Figure 2 in Alderdice et al., 2022a), yet colonies of A. selago and A. tenuis did exhibit differential susceptibility to hypoxia and bleaching (Alderdice et al., 2020). Moreover, these corals differed in the expression of HIF and HIF target genes in response to deoxygenation stress (Alderdice et al., 2020). Therefore, gene copy number alone cannot yet explain hypoxia tolerance. These studies reinforce the need to address gene expression that could identify the mechanisms underlying the ability of corals to withstand prolonged severe deoxygenation, where acclimation to hypoxia can take place. Additionally, due to the presence of photosynthetic symbionts, the effect of the continuous diurnal internal oxygen changes on the coral transcriptional response should be addressed.
The physiological responses of corals that could manifest in order to acclimate to prolonged severe deoxygenation stress are not yet clear. It is reported that deep-sea corals in the Red Sea, that live at remarkably low O2 levels of ~2 mg L-1, exhibit low calcification rates and minimized tissue cover, indicating that reduced metabolism could be one of the key adaptations to prevailing environmental conditions (Roder et al., 2013). Also, reduced calcification rates (Krief et al., 2010) and tissue loss (Kvitt et al., 2015) were reported in pH-stressed corals, suggesting that in order to maintain homeostasis under stress conditions corals rid themselves of energetically costly processes (Kvitt et al., 2015). Parameters of tissue loss (Johnson et al., 2021b), reduced chlorophyll concentration and reduction in photophysiology of symbionts (Johnson et al., 2021b) (Alva García et al., 2022) and reduced symbiont numbers (Alderdice et al., 2020) (Johnson et al., 2021b) (Alva García et al., 2022) were reported to differ between corals species exposed to deoxygenation. Therefore, all these measurements were included in our study.
Corals’ metabolic relationship with their oxygen-producing symbionts might also be affected by deoxygenation. Corals are sterol auxotrophs, receiving the bulk of these components from their symbionts, via highly conserved cholesterol binders (NPCs) (Hambleton et al., 2019). In addition to sterols, corals are highly dependent on photosynthetically fixed carbon, translocated from their symbionts and stored by the coral in the form of glycogen (Kopp et al., 2015). However, the effect of deoxygenation on this coral-symbiont relationship has never been studied.
Here we sought to investigate the physiological and transcriptional response to prolonged severe deoxygenation in the Scleractinian coral, Stylophora pistillata, that is reported to be thermally tolerant (Kvitt et al., 2011). To that end, we subjected corals to extreme, yet environmentally relevant, deoxygenation conditions (Altieri et al., 2017) for two weeks. During this treatment, we measured physiological parameters of the coral and its symbionts as well as diurnal transcriptional profiles of the coral, at several time points. We revealed that S. pistillata can endure severe prolonged deoxygenation without significant physiological responses, possibly due to the extensive transcriptional response of evolutionary conserved and coral specific genes.
Materials and methods
Coral collection, maintenance, experimental design, and sampling
Corals were collected under the Israel Nature and National Parks Protection Authority permit number 2018/41994. Coral fragments (2 cm long) from three Stylophora pistillata colonies (28 fragments per colony) were collected at a depth of 4–5 meters from the coral nursery of the Inter-University Institute (IUI) in the Gulf of Eilat Red Sea (28.6929°N, 34.7299°E) in February 2019 and immediately transported to a controlled environment aquarium system at the Leon H. Charny School of Marine Sciences in the University of Haifa, Israel. The fragments were glued onto pin-like bases (see Figure 1 in Zaquin et al., 2019) and allowed to recover for two weeks under simulated ambient conditions (light parameters, temperature, salinity, pH, calcium, magnesium, phosphate and nitrate), replicating the IUI coral nursery conditions that were tested biweekly and adjusted to standards as needed. Dissolved oxygen (DO) levels of ~5.5 mg L-1, simulating the average normoxic conditions at the site of collection (Drake et al., 2021), were maintained via continuous aeration. Water changes of 10% were performed on a weekly basis using artificial seawater (Red Sea Salt, Red Sea Ltd.) and all corals were fed identical food twice a week (Microvore, Brightwell Aquatics, Fort Payne, AL).
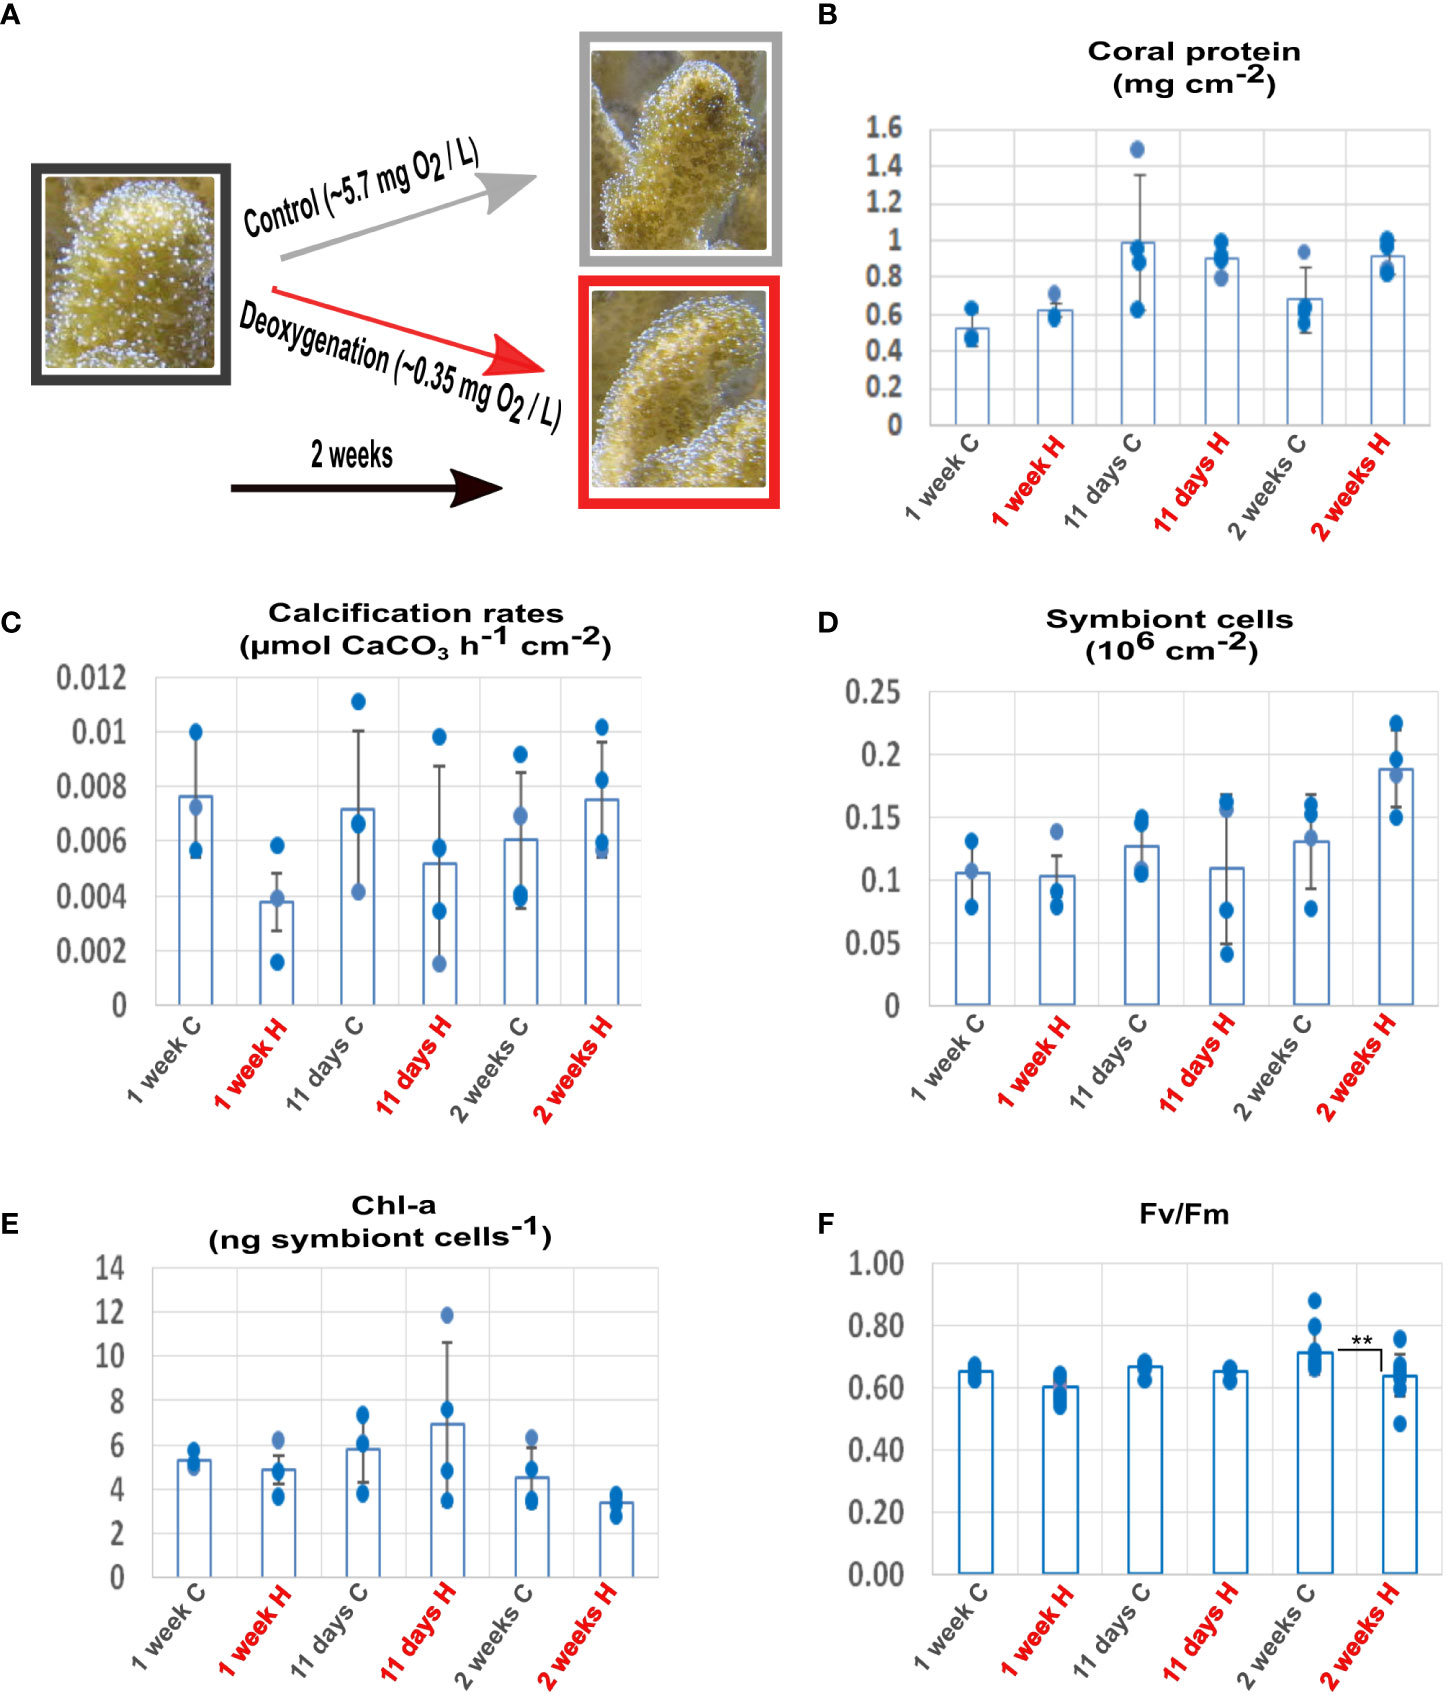
Figure 1 Effects of deoxygenation on the physiology of coral and symbionts. (A) Coral fragments were incubated in control (grey) or subjected to deoxygenation (red) for two weeks. For each time point, measurements were calculated for distinct fragments. (B) Protein amount. (C) Calcification rates. (D) Symbiont cell counts. (E) Chlorophyll-a (chl-a) concentration per symbiont cell. (F) Maximum (Fv/Fm) quantum yield of photosystem II. **P< 0.01. (Data S7).
After an acclimation period of two weeks in the same aquarium system, four identical 20 L aquaria were established, two aquaria for each treatment (deoxygenation and control). Fragments from the three colonies were placed in each aquarium, so that in each aquarium all three colonies (i.e., genotypes) were represented, and acclimated again for 5 days (Figure S2A). The aquaria were designed with airtight lids containing holes fitted for nitrogen bubbling, a water pump, a multi-parameter measuring device, and a water inlet/outlet. A water pump was used to ensure constant water circulation and to maintain homogenous DO levels. DO concentrations were measured every 15 minutes with a multi-parameter measuring device (WTW Multi 3420, Xylem analytics, Germany). Reduced DO concentrations (deoxygenation) in the experimental aquaria were generated by bubbling the water with nitrogen (Haas et al., 2014), (Johnson et al., 2021b) and kept at a level of 0.34 mg L-1 (± 0.16 mg L-1) that is close to the minimum level of 0.5-0.2 mg L-1 observed in water-quality surveys (Altieri et al., 2017) (Johnson et al., 2021a) and in laboratory experiments (Figure S3) (Altieri et al., 2017). By manipulating O2 levels alone, pathways of acclimation to this specific stressor might be resolved (Johnson et al., 2021b). However, as deoxygenation is also accompanied with alterations in CO2 and pH (Klein et al., 2017), our laboratory conditions did not address acclimatization of S. pistillata to natural deoxygenation.
For RNA extractions, three fragments (one from each colony) from each treatment (deoxygenation and control) were sampled at five time points: three time points at night, after 12 hours, one week, and two weeks of incubation in deoxygenation; and two time points at day, after one week and two weeks of incubation in deoxygenation (Figure S2B). In order to represent both the colony (i.e., genotype) and the aquarium at each sampling point, the sampling of colonies within treatment and within control was randomized but the following criteria were considered: the same colony combination (e.g., colonies 1 and 2) will not be sampled from the same aquarium at consecutive times, and at all time-point both aquaria per treatment were sampled. Therefore, all three colonies were represented at each sampling time point. Hence, controlling for colony effect was enabled (Figure S2B, C). The fragments were snap-frozen with liquid nitrogen, and stored at -80°C. For DNA extractions, the same fragments sampled for RNA after one week and two weeks were used (n=6 for control and deoxygenation, night and day sampling combined). Additionally, four fragments (three from different colonies and one randomly chosen) from each treatment (control and deoxygenation) were snap-frozen and used for DNA extractions (n=10 in total for DNA extractions). In order to be consistent with other studies, the time points for the physiological measurements were 1 week (Altieri et al., 2017) and 11 days (Johnson et al., 2021b), reporting prolonged deoxygenation, in addition to our 14 day deoxygenation experiment. For calcification rates fragments from the three different colonies were sampled at the same time of day from each of the control and deoxygenation treated aquaria (n=3 for 1 week, n=4 for 11 days and for 2 weeks; see Figure S2). The same fragments were used for protein extraction, symbiont density counts, and chlorophyll-a quantification (see below). The extensive time series design restricted the number of fragments used for each measurement, resulting in replicate numbers of n=3 for transcriptom analysis and n=3 or 4 for calcification rates, protein extraction, algal symbiont density, and chlorophyll-a quantification. However, this replicate number is in accordance with other similar works [e.g., (Johnson et al., 2021b), (Alderdice et al., 2020)] and is considered sufficient to acquire information.
Calcification rates
To understand the effect of prolonged deoxygenation on coral growth, calcification rates were determined using the total alkalinity (TA) anomaly method with minor modifications, as described (Zaquin et al., 2019). In brief, each fragment was sealed in a specimen cup filled with 0.22 mm of filtered artificial seawater collected from the aquarium system holding the fragments. For deoxygenation, the filtered artificial seawater was bubbled with nitrogen (Haas et al., 2014; Johnson et al., 2021b) to achieve hypoxic O2 levels of 0.34 mg L-1 before sealing the cups. The cups were kept in their respective aquarium systems for 1.5 h. Water samples were collected for TA at the beginning of the incubation and at the end of the incubation after 1.5 h from each specific cup. Water samples were filtered to remove debris and measured with an automatic alkalinity titrator (855 Robotic Titrosampler, Metrohm, Switzerland). The calcification rates [µmol CaCO3 cm-2 h-1] were then calculated using the equation proposed (Schneider and Erez, 2006):
where ΔTA [µmol g-1] is the difference in alkalinity between the beginning and the end of the incubation period; V is the recorded volume of the artificial seawater in the respective
incubated cup [ml]; 1.028 is the density of seawater in the northern Gulf of Eilat [g ml-1]; and SA is the surface area of the coral (cm2) estimated as described (Veal et al., 2010); T is the duration of the incubation [hours].
Protein extraction, symbiont density, and chlorophyll-a quantification
To quantify coral tissue loss, protein concentrations were calculated and normalized to skeletal surface area (cm2). To assess the symbiont-host-system, symbiont density was calculated and normalized to skeletal surface area (cm2). To assess symbiont physiology, chlorophyll-a concentration per symbiont cell was calculated.
After measuring calcification rates, the same fragments were frozen in liquid nitrogen and kept at -80°C. Coral tissue was removed by an airbrush connected to a reservoir of phosphate buffer saline (PBS) solution filtered through a 0.22 mm filter, and the skeletons were kept for further analysis. The extracted tissue was mechanically disrupted using an electrical homogenizer (HOG-160-1/2, MRC Labs, Israel) for 3 × 10 s at the maximum power setting of 10. The density of zooxanthellae in the homogenate was determined from three replicate counts of the homogenized seawater slurry using a haemocytometer (Improved Neubauer, BOECO Germany) under a microscope and normalized to coral surface area (Veal et al., 2010). The homogenate was centrifuged at 5000 g for 5 min at 4°C to separate the debris and the zooxanthellae cells from the coral host tissue. A protease inhibitor cocktail (cat. G652A, Promega, United States) was added to the supernatant with the host tissue and sonicated for 3 × 30 s (Ultrasonic cell crusher, MRC Labs, Israel). The protein concentration of the coral host was determined using a fluorometric BCA protein kit (Pierce BCA, United States) following the manufacturer protocol. A PerkinElmer (2300 EnSpireR, United States) plate reader was used to determine the total protein concentration with a 540 nm wavelength emission. To measure the chlorophyll-a (chl-a) concentrations of the zooxanthellae, 1 ml of 90% cold acetone was added to the pellet. The pellet was homogenized and incubated overnight at 4°C in the dark. The solution was filtered into a glass cuvette through a 0.22 mm syringe filter (Zaquin et al., 2019). A NanoDrop (Thermo-Fisher, United States) was used for spectrophotometric measurements at wavelengths of 630, 647, 664, and 691 nm, and the light absorbance results were used to calculate the chl-a concentration based on the following equation (Ritchie, 2008):
Photochemical efficiency
To assess the effect of deoxygenation on the photophysiology of symbionts, the photochemical efficiency of the symbionts in the coral host was measured. Photochemical efficiency of the algal symbiont was assessed with quantum yield of chlorophyll-a fluorescence measured with an underwater diving-PAM fluorometer (Walz, Effeltrich, Germany) as previously described (Johnson et al., 2021b) with slight modifications: saturation intensity=7 and measuring light intensity=6. Measurements of the maximum (Fv/Fm) quantum yield of photosystem II were taken at one week, 11 days and two weeks of incubation under deoxygenation. Coral fragments from each treatment were randomly chosen (representing all three colonies) and were measured after two hours of the dark period. All measurements were conducted in triplicates per each coral fragment in order to minimize variations.
DNA extraction
Total DNA from frozen coral fragments was isolated using the Wizard® SV genomic DNA purification system tissue protocol (Promega, WI, United States) according to the manufacturer’s instructions. DNA concentration and quality were evaluated using the NanoDrop 2000c (Thermo Scientific, United States).
Quantitative real-time PCR
Changes in the amount of mitochondrial DNA were determined relative to the DNA of a nuclear single-copy gene (that has two copies/diploid genome) (Nicklas et al., 2004). qRT–PCR primers were designed using the software Primer Express 3.0 (Applied Biosystems, CA, USA). Primers were planned for the S. Pistillata mitochondrial gene Cox1 (AB_441231) (F-CCTCTTGCTAGTATTCAAGCACAC;R-TTTATTAAAAGACACACCCGGGGCTCG) and the nuclear Timeless gene (XM_022932799) (F-CCAGAAGATGAAGAGATGGCAGCAG; R-TAATACTTCAAAAGCCAGCAGTATGG). Transcript levels were determined by qRT–PCR using the 7500 Fast Real-Time PCR system (Applied Biosystems). Thermal cycling was 95°C for 10 min, followed by 40 cycles of 95°C for 15 s, and 60°C for 100 s, then a final extension at 60°C for 1 min. Triplicate reactions were carried out in 20 μL volumes consisting of: 1× FastStart SYBR Green Master Mix (Applied Biosystems), 0.25 μM of each forward/reverse primer set, 20ng DNA, and PCR grade water. The difference between CT values of Cox1 and Timeless in each sample was used as a measure of relative abundance of the mitochondrial genome (Nicklas et al., 2004).
Statistical analysis
Statistical analysis of calcification rates, zooxanthellae cell numbers, chlorophyll-a and Cox1 transcription levels between the control and deoxygenation group at each sampling point was done in R. For each measurement, the Shapiro-Wilk test for normality and the Levent test of homogeneity of variance were performed. Where normality and homogeneity of variance were confirmed, Two-way ANOVA test were performed (calcification rates, zooxanthellae cell numbers and chlorophyll -a). For the Cox1 transcription measurements normal distribution could not be assumed (Shpiro-Wilk W=0.825, P<0.05). Therefore, the Aligned Rank Transform Analysis of Variance (ART ANOVA) was done with R package ARTool (Mansouri et al., 2004). This test allows for non-parametric, rank based factorial analysis of variance.
RNA extraction, processing, sequencing and differential expression analysis
Total RNA was extracted from all 30 fragments using TRIzol reagent, Pure Link RNA kit and Pure Link DNase (Invitrogen, CA, United States) according to manufacturer’s instructions. Purified RNA samples were analyzed using a Nano Drop 1000c spectrophotometer (Thermo Scientific, United States) to assess RNA quantity and the 2200 Tape Station (Agilent, United States) to assess RNA quality (RIN > 8.5). RNA-Seq libraries were prepared using an in-house protocol at the Weizmann Institute of Science. RNA-Seq single end (SE) reads were adapter trimmed using cutadapt 1.5 (https://cutadapt.readthedocs.io), and quality filtered with Trimmomatic 0.30 (Bolger et al., 2014). In order to detect the species origin of symbiont sequences, high-quality reads were mapped to the selected proteomes databases of Symbiodinium/SAR and cnidarian/metazoa, using Diamond (Buchfink et al., 2015). Top hits almost exclusively belonged to robust corals (mainly S. pistillata), and Symbiodinium “clade A” species (mainly Symbiodinium microadriaticum). We further aligned the reads to the host genome assembly (NCBI GCA_002571385.1) and the symbiont genome assembly (NCBI GCA_001939145.1) using STAR 2.5 (Voolstra et al., 2017). For different samples, 82-86% of the reads were concordantly aligned to S. pistillata genome, and 0.7-3.8% to S. microadriaticum. For the host genes, DE analysis was conducted using the Generalized Linear Model (GLM) framework of DESeq2 (Love et al., 2014). Three factors were considered: Treatment (H, C), Diurnal (Day: zt6; Night: zt18), Temporal (12 hour, 1 week, 2 weeks), in the following two formulas in DESeq2: (a) “~ Treatment + Diurnal + Temporal + Treatment : Diurnal + Treatment : Temporal + colony”; (b) “~ x + colony”, where the x factor is a string combination of the factors: Treatment, Diurnal, Temporal (e.g., “Control_Night_day1”, “Deoxygenation_Night_day1”, etc…). Colony was added as a factor to all formula in order to control for the colony effect. The first formula models the additive effect of three factors plus interaction effects of treatment with the diurnal factor, and with the Temporal factor (Data S1 and S2). Heatmap results are based on FPKM (Fragments per kb million), and multidimensional scaling ordination (NMDS) were conducted using Vegan tool in R. All significant results shown here have Benjamini and Hochberg (BH) adjusted p-values<0.05.
Orthologous gene identification
Proteome sequences of the tested metazoan species (Data S3) were clustered using Orthofinder 2.4.0 (Emms and Kelly, 2015), to give ~16,000 orthogroups (Data S3). Each orthogroup represents a cluster of protein sequences that share sequence similarity. That similarity indicates that these genes are descended from a single gene in the last common ancestor of a clade of species. For each orthogroup, sequences were aligned using MAFFT (Rozewicki et al., 2019), and poorly aligned sequences/sites were removed. Gene trees were constructed with iqtree (Nguyen et al., 2014), using the model option “LG+G4”, namely: an improved general amino acid replacement matrix (10.1093/molbev/msn067), plus discrete Gamma distribution of 4 rates across sites categories. Iqtree provides binary unrooted trees, and we further rooted the tree and estimated orthology relationships between proteins (one:one, one:many, many:many) using Orthofinder pipeline (Emms and Kelly, 2019). In order to estimate orthology in Orthofinder, the well-established Opisthokonta species tree was considered as reference. We also used reciprocal Blast between S. pistillata and homo sapiens, in order to find closely-related homologous genes that were not identified as orthologous genes. We also considered closely related cnidarians vs. Deuterostomia genes belonging to relatively small Orthogroups. Coral gene symbols were determined based on human 1:1 orthology, or otherwise we used the prefix of the gene family symbol. For selected gene trees (specifically PHD4 and HIFs family), we further tested that aligned S. pistillata sequences are not highly segmented. For that, the S. pistillata members of these gene families were aligned by multiple alignment using MAFFT (Rozewicki et al., 2019). The alignment was manually inspected. It is noted here that the proteome data used for S. pistillata for orthology analysis are directly related to the transcriptome data used for gene expression quantification.
Databases and functional enrichment
Genes’ biological terms were assigned based on Uniprot S. pistillata (www.uniprot.org), KEGG S. pistillata (www.kegg.jp), S. pistillata Trinotate annotations (Bryant et al., 2017), and Uniprot S. microadriaticum databases. Enrichment analysis was conducted in Bioconductor GOSeq (Subramanian et al., 2005), as described previously (Malik et al., 2021).
Results
Prolonged severe deoxygenation did not affect the physiology of the coral or its symbionts
We wanted to study the response of S. pistillata and its symbionts to severe prolonged deoxygenation conditions, not hitherto exerted under laboratory conditions yet relevant to acute deoxygenation events recorded on coral reefs. Therefore, in this experiment, coral fragments were subjected to over two weeks of deoxygenation where the oxygen level was 0.34 mg L-1 (± 0.16 mg L-1) (Figure S3).
The morphology and physiology of the coral and its symbionts showed high tolerance to the prolonged deoxygenation. All the coral fragments survived two weeks of severe deoxygenation conditions, without apparent morphological changes (Figure 1A). After one week of deoxygenation, coral protein amount was unaffected by treatment (n=3 for 1 week; n=4 for 11 days and for 2 weeks p=0.063) (Figure 1B). Coral calcification rates showed a trend of reduction that was not significant (n=3 for 1 week; n=4 for 11 days and for 2 weeks, p =0.295), resuming control levels after two weeks (Figure 1C). Symbiont numbers showed a trend of increase after two weeks of deoxygenation that was not significant (n=3 for 1 week; n=4 for 11 days and for 2 weeks, p =0.277) (Figure 1D). The chlorophyll-a content per symbiont cell showed a trend of decrease after two weeks of deoxygenation that was not significant (n=3 for 1 week; n=4 for 11 days and for 2 weeks p=0.174) (Figure 1E). The photochemical efficiency (Fv/Fm) of the symbionts decreased by 4% after two weeks of deoxygenation. Although this decrease was statistically significant (n=12 for 1 week and 11 days; n=9 for 2 weeks p= 0.0019) (Figure 1F), we cannot assume it has biological significance as decreases of 40-50% after three to five days are reported for deoxygenation stress (Johnson et al., 2021b). These results indicate that S. pistillata, the symbiont and the host-symbiont system are tolerant to a prolonged reduction in oxygen levels.
The transcriptional response to deoxygenation is stronger at night-time
To point to molecular mechanisms that may enable the tolerance of S. pistillata to the deoxygenation conditions applied here, we measured the corals’ diurnal transcriptional profiles (midnight, zeitgeber time 18; and midday, zeitgeber time 6) at different time points (12 h, 1 week, and 2 weeks) during the prolonged deoxygenation (Figure S2B). Gene expression was quantified based on mapping sequence reads to the S. pistillata genome assembly (see Methods) and identified 24,577 expressed putative genes (hereafter termed “genes”).
To identify the general trends of gene expression in control and deoxygenation conditions through time, we performed a non-metric multidimensional scaling (NMDS, Figure 2A). The NMDS clearly separates the samples of night deoxygenation from the rest of the samples (Figure 2A). The most distinct samples are the night-time samples from 12h and one week of deoxygenation. After two weeks of deoxygenation, two of night-time deoxygenation samples are close to the day-time deoxygenation samples, which are relatively close to the controls. These results point towards a dynamic acclimation to the deoxygenation conditions over the two weeks of the experiment. Genes that were differentially expressed (DE) under the deoxygenation treatment were identified by comparing deoxygenation to control (from here on this comparison is referred to as HvsC) at each sampling time point. Differences were considered significant for Benjamini-Hochberg adjusted P<0.05 (see Experimental procedures for details on annotations and statistics).
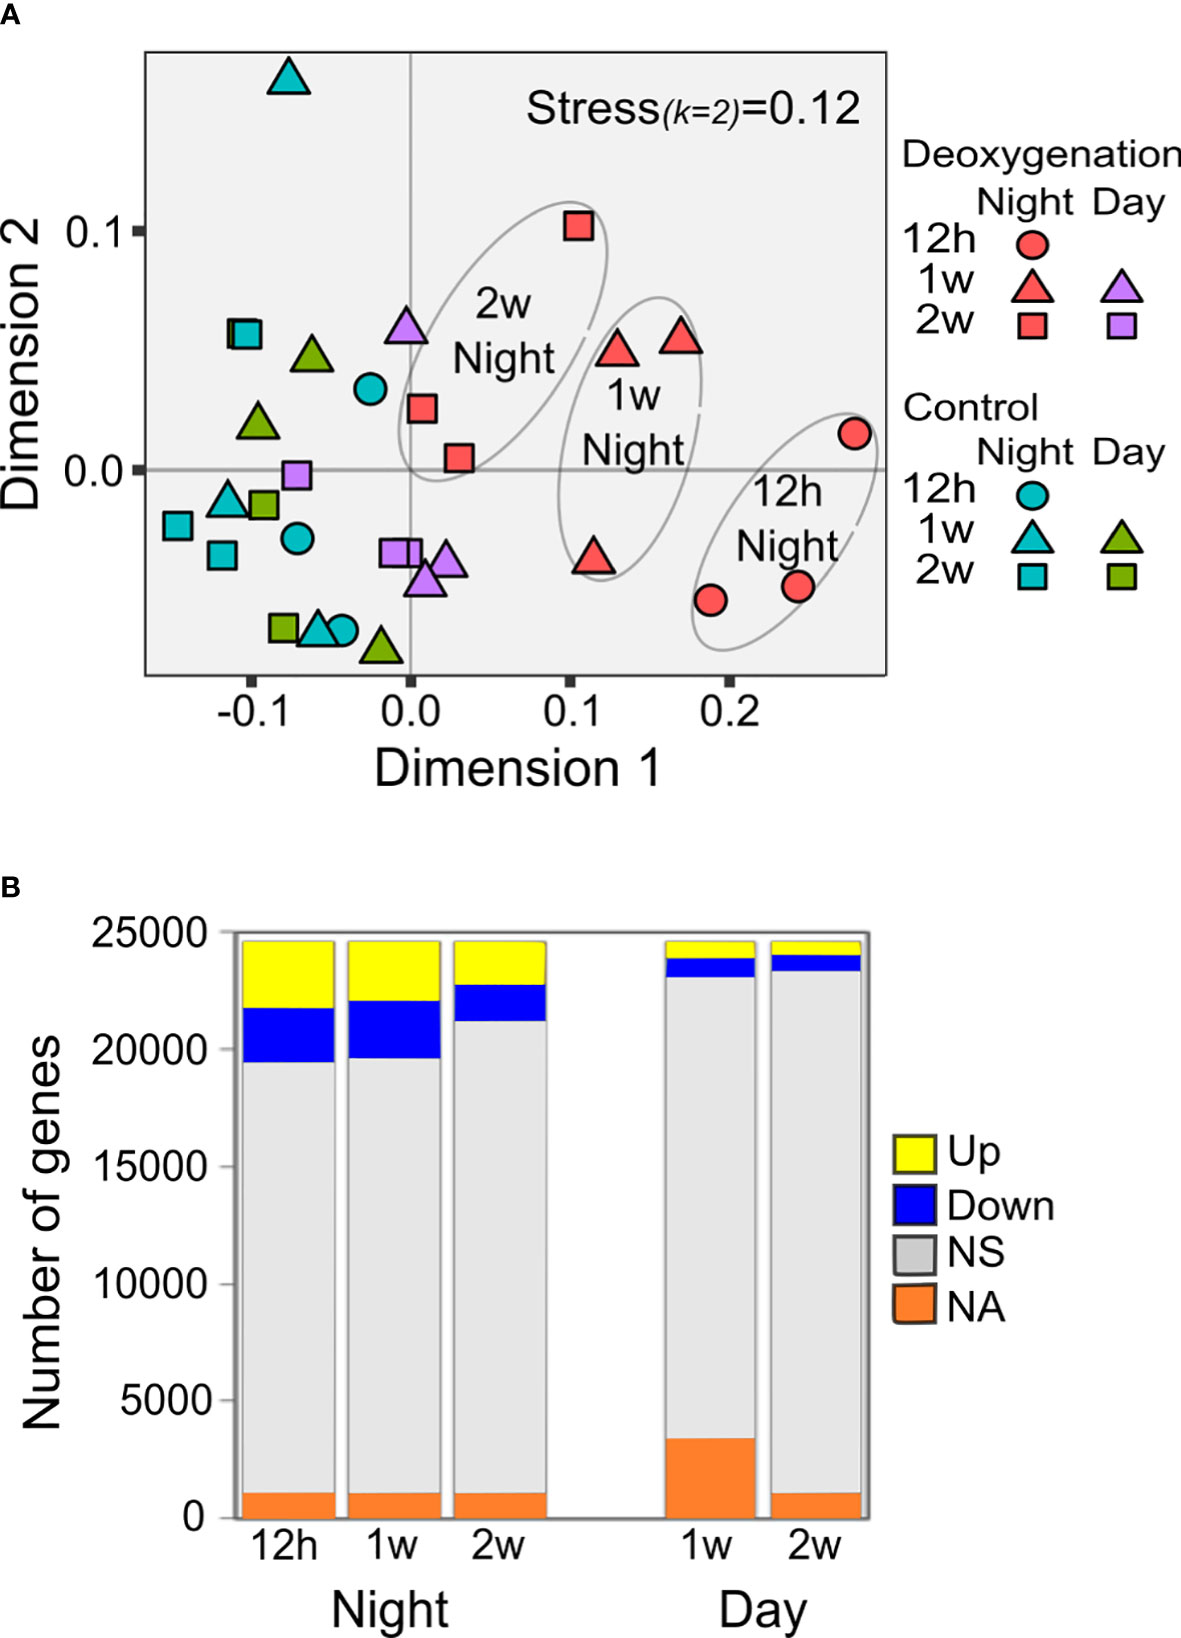
Figure 2 Transcriptional response to deoxygenation. (A) Non-metric multidimensional scaling analysis (NMDS)-based ordination presenting dissimilarity between transcriptomes of S. pistillata placed under control or constant deoxygenation. Corals were sampled at night and day, after 12 hours, one week, and two weeks from the onset of deoxygenation (n=3).Bray-Curtis distance matrix using log10FPKM-based Bray-Curtis distances. (B) Total counts of HvsC up/down-regulated DE genes between comparable time-points (same daytime, same week). NS- not significant, NA- not applicable for statistical analysis (Data S4).
The number of genes showing significant differential expression (DE, p<0.05) in HvsC at each time point was higher at night compared to the number of DE genes during the day (Figure 2B). The number of DE genes at night decreases after two weeks (Figure 2B) in agreement with the trend shown by the NMDS results (Figure 2A). Thus, based on both NMDS and HvsC DE genes, the transcriptional response to deoxygenation was more extensive at night than during the day, and was gradually reduced with time.
Then, we used functional enrichment analysis to illuminate pathways significantly affected by deoxygenation. To put our results in an evolutionary context, we investigated the expression of conserved hypoxia-related orthologous genes. We also looked for coral-specific genes that include acquisition of components from the symbionts and stinging cell formation.
Night-time transcriptional response to deoxygenation points to highly conserved mechanisms, including increased mitochondrial activity and numbers
We sought to better understand the effect of deoxygenation at night-time, when both coral and algae are respiring and oxygen levels are extremely low, as compared to day-time, when photosynthesis occurs and oxygen is produced (Kühl et al., 1995), (Linsmayer et al., 2020). To that end, we identified DE genes that their response to deoxygenation was significantly different between the night-time points and the two day-time points (HvsC x Day vs Night interaction model, Figure 3A). We divided these genes into two sets, genes that their HvsC was up-regulated at night compared to the day (color coded in orange in Figure 3A), and genes that their HvsC was down-regulated at night (color coded in purple in Figure 3A). The set of genes that showed significant up-regulation of HvsC at night compared to the day, was larger (1101 genes) than the set that showed significant HvsC down-regulation at night compared to the day (442 genes) (Figure 3A, Data S1). We then looked for statistically significant overrepresentation of specific functional groups within these two sets, and identified more functional groups within night-up-regulated genes (15 groups) rather than night-down-regulated ones (two groups) (Table 1, Data S2).
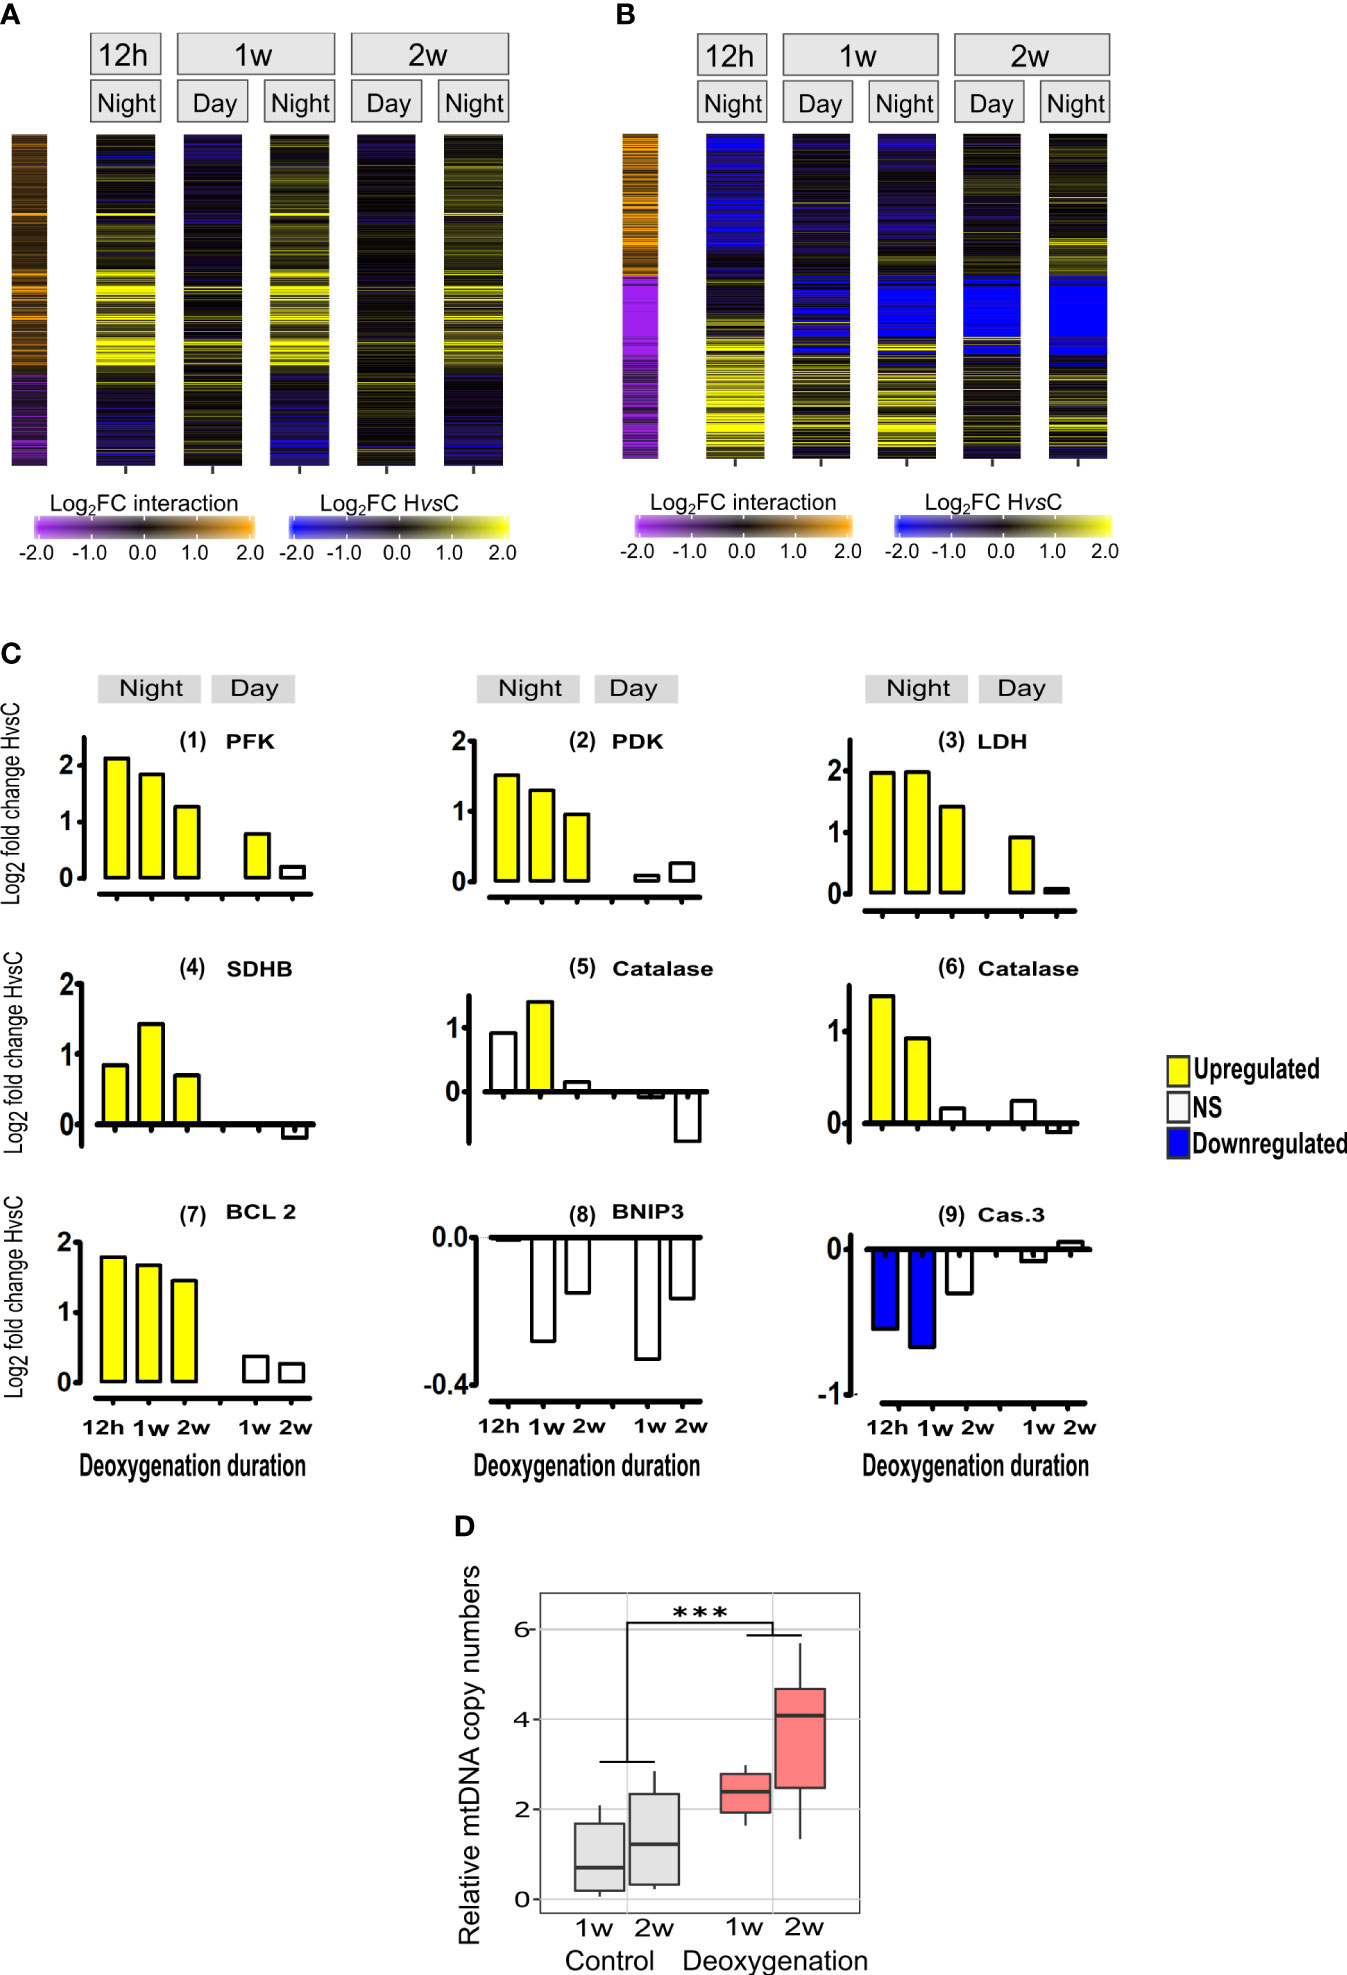
Figure 3 Diurnal-dependent and time-dependent changes of the transcriptional response to deoxygenation in S. pistillata and mitochondria DNA copy numbers. (A) Heatmap representing genes exhibiting diurnal-dependent changes of the intensity of response to deoxygenation. For each time point, log2 fold change of expression differences between HvsC are color-coded as blue-black-yellow gradient. Represented genes that have significant HvsC x Day vs Night interactions using DESeq2 are color-coded in orange-black-purple scale shown on the left-side of the heatmap. Interaction log2FC values are color-coded as yellow-black-blue gradient. Log2FC values lower than -2 or higher than 2 are color-coded as maximum values (Data S1 and Table 1). (B) Heatmap representing genes exhibiting time-dependent changes of the intensity of response to deoxygenation. Details are as in part A of this figure and represented genes that have significant HvsC x Time interactions using DESeq2 (Data S1 and Table 2).(C) Expression of orthologs of major genes: (1) Phosphofructokinase (PFK) (gene24349); (2) Pyruvate dehydrogenase kinase (PDK) (gene21622); (3) Lactate dehydrogenase (LDH) (gene17088);(4) Succinate dehydrogenase [ubiquinone] iron-sulfur subunit, mitochondrial (SDHB) (gene 10554); (5),(6) Catalases, (gene 3500 and gene 18116, respectively); (7) anti-apoptosis styBCL2 (Kvitt et al., 2016) (gene22055); (8); Mitopagy inducing BCL2/adenovirus E1B 19 kDa protein-interacting protein 3 (BNIP3) (gene5649); (9) executioner of apoptosis styCaspase3 (Casp3) (Kvitt et al., 2016) (gene6838). DE (p<0.05) of HvsC response is represented as Log2FoldChange. NS- not significant. (D) Quantitative analysis of mitochondrial Cox1 gene DNA normalized to nuclear Timeless gene DNA. Results are expressed in boxplots of independent DNA extractions from distinct fragments (n=10, one week; n=8, two weeks) incubated in control (grey) or subjected to deoxygenation (red) (see Figure S2B). Values were compared by the aligned rank transform test with significant effects for treatment (DF=1, F=20.6, p<0.0001). Asterisks indicate significant differences (Data S4).
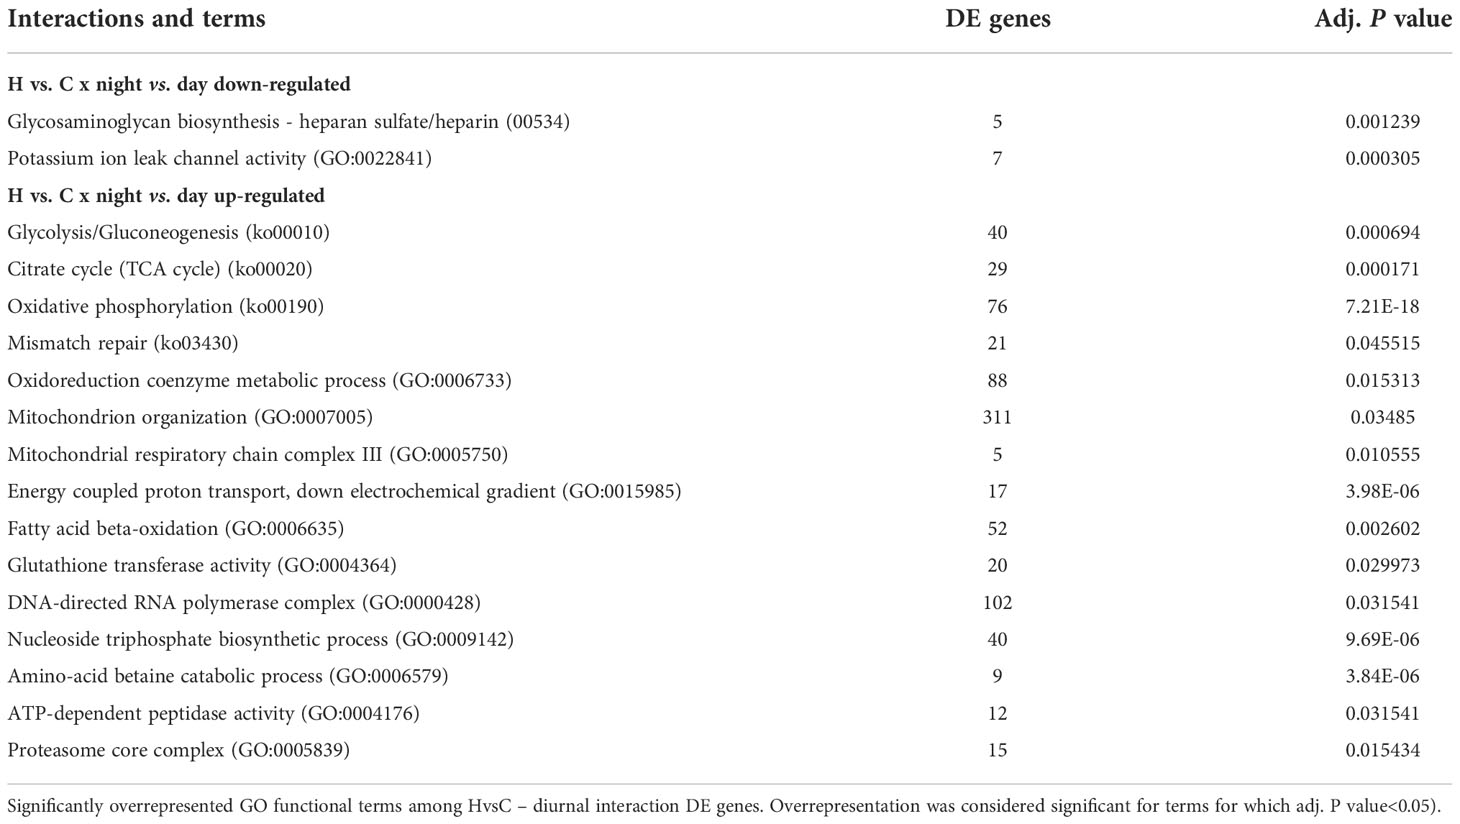
Table 1 Diurnal changes in transcriptional response to deoxygenation, in S. pistillata.
Within the night-up-regulated genes, enrichment was found in genes related to mechanisms of energy production by the mitochondria, that are part of the highly conserved hypoxia response in metazoans (e.g., GO terms of glycolysis/gluconeogenesis, fatty acid beta-oxidation and oxidative phosphorylation), suggesting enhanced mitochondria activity. The night-time up-regulation of glycolysis rather than gluconeogenesis is supported by the expression of major genes in this pathway (Figure 3C (1)-(3)). Specifically, phosphofructokinase (PFK), the rate-limiting enzyme for glycolysis and a direct HIF target gene is significantly up-regulated in HvsC at all night-time points and at day-time after 1 week, and its expression is higher at night (Figure 3C (1)). Up-regulation of oxidative phosphorylation genes, including subunits of the electron transport chain (ETC, represented in Table 1 by the GO term: mitochondrial respiratory chain complex III) is exemplified by the expression of Succinate dehydrogenase [ubiquinone] iron-sulfur subunit, mitochondrial (SDHB) gene. SDHB was significantly up-regulated at all night-time points (Figure 3C (4)). Enhanced antioxidant activity is indicated by the enrichment in glutathione transferase activity GO term (Table 1) and the expression of anti-oxidant catalase genes that was up- regulated at night-time ((Figure 3C, (5) and (6)). Also, DNA replication and repair were enriched with up-regulated genes, suggesting enhanced maintenance of cellular integrity (Table 1).
The observed enrichment in genes related to mitochondria dynamics (i.e., mitochondrion organization), suggests possible changes in the number and composition of the mitochondria. These changes could include increasing mitochondria numbers (e.g., by replication of the mitochondrial genome as well as synthesis of new mitochondrial components) or conversely, reduction in mitochondria numbers (e.g., by disassembly of mitochondria or by apoptosis/mitophagy). The expression of central genes of apoptosis/mitophagy show that the anti-apoptotic gene styBcl-2 was up-regulated at night time (Figure 3C, (7)) and the pro-apoptotic, executioner of apoptosis gene styCaspase-3 was down-regulated (Figure 3C, (9)). Also, BNIP, the major mitophagy-inducing and HIF target gene was not DE (Figure 3B, (8)). Accordingly, these pathways of reducing cells/tissues/mitochondria numbers were not induced. To better understand the effect of deoxygenation on mitochondria dynamics we searched for mitochondria-related functional enrichment in the HvsC comparisons for each time point. An increase in the number of mitochondria is suggested by the enrichment of up-regulated genes in the “mitochondria biogenesis” functional group at night-time at one and two weeks and at day-time at two weeks (Figure S4). Additionally, after two weeks at day-time the functional group “mitophagy” was enriched with down-regulated genes (Figure S4). Therefore, we studied the mitochondrial DNA copies to establish how mitochondria numbers were affected by deoxygenation. By using quantitative real-time PCR we confirmed a significant increase in mitochondria DNA copy numbers after one to two weeks of deoxygenation (Figure 3D), suggesting mitochondria numbers are increased.
Taken together these results suggest that at night-time, deoxygenation imposes great demand for energy production, possibly provided by increasing mitochondria numbers.
Molecular acclimation to deoxygenation includes reduction of metabolic response and maintaining DNA integrity
We wanted to investigate the molecular acclimation to prolonged deoxygenation as compared to the immediate acute response. To do that we identified DE genes that their response to deoxygenation (HvsC) was significantly different between the 1st night and the 1st week night of deoxygenation, and between the 1st night and the 2nd week-night of deoxygenation (temporal interactions, Figure 3B). We divided these genes into two sets, genes that their HvsC was up-regulated over time in the 2nd week or 1st week compared to the 1st night (color coded in orange in Figure 3B), and genes that their HvsC was down-regulated over time (purple coded in Figure 3B). We then looked for statistically significant overrepresentation of specific functional groups within these sets (Table 2, Data S2).
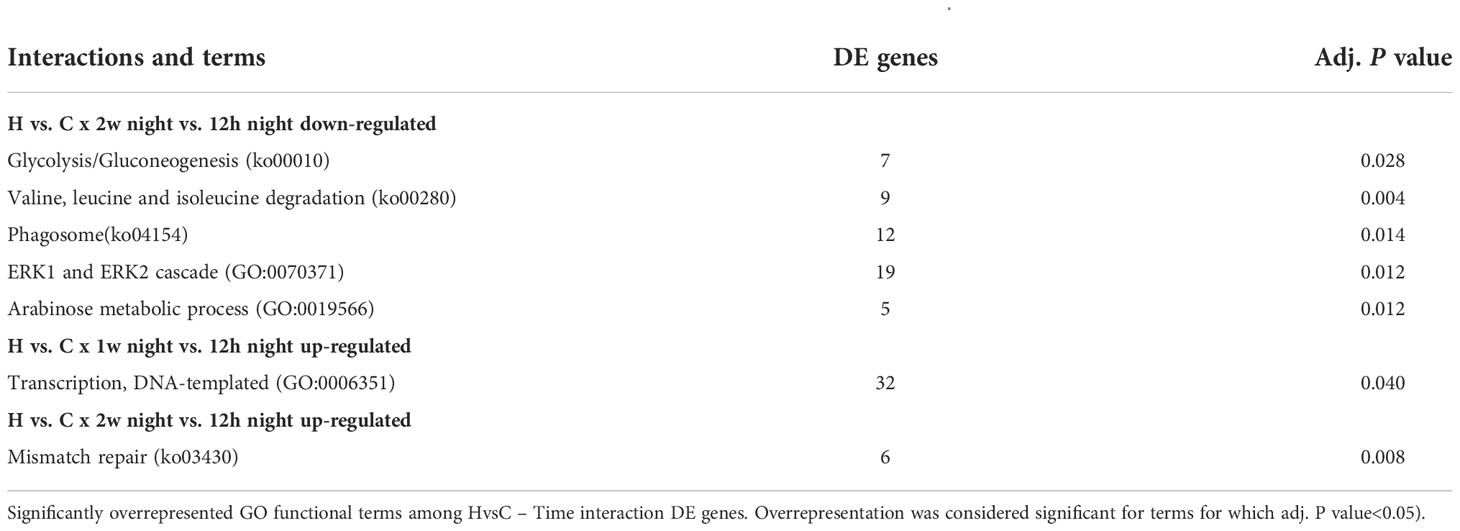
Table 2 Time-dependent changes in transcriptional response to deoxygenation, in S. pistillata.
Genes that their HvsC was down-regulated over time were related to metabolism, e.g., glycolysis, valine, leucine and isoleucine degradation, arabinose metabolic process and phagosome. This suggests that the acute metabolic-related response to deoxygenation is followed by metabolic acclimation to prolonged deoxygenation. For example, the expression of PFK, PDK and LDHA subsided over time (Figure 3B (1)-(3)). At night-time up-regulation of transcription at 1st week and of the mismatch repair pathway at 2nd week of deoxygenation as compared to the first 12 hours was observed. Overall, the molecular acclimation to deoxygenation is reflected in the decrease of the metabolic response and maintenance of DNA correction. Also, after two weeks gene expression patterns at Day and Night are more similar than at one week (Figure 3C, 2W), as observed for the whole transcriptome analysis (Figure 2A).
Oxygen sensing, HIF family and HIF target genes show conserved response to deoxygenation
We next wanted to test whether the conserved components of the hypoxia pathway of S. pistillata respond to deoxygenation in a similar temporal sequence as in other metazoans. This sequence includes down-regulation of PHDs, stabilization and up-regulation of HIF-α, HIF-α association with HIF-β and HIF complex formation, HIF activation of its target genes (Shaw, 2008; Lendahl et al., 2009; Fuhrmann and Brüne, 2017) (Figure S1). Specifically, we focused on PHDs orthologs, since up regulation of HIF-α and activation of its target genes were identified in corals, but only one PHD2 was identified and its expression was up-regulated rather than down-regulated (Alderdice et al., 2021), (Alderdice et al., 2020). To do that, we identified the relevant orthologous genes in S. pistillata genome, established their evolutionary position and then followed their transcription in HvsC (see methods Data S5).
The PHD1-3 family gene tree indicates that Cnidaria have only two PHD1-3 orthologs (Figure S5A). One of them (PHD3 homolog) was up-regulated at all time points, and the change in its expression level was remarkably high (Figure S5B). In contrast, the PHD4 tree included a single human PHD4 gene, and many S. pistillata orthologs, comprising 16 groups in total (Figure 4A). This expansion is evident only in Cnidaria containing photosynthetic symbionts (i.e., S. pistillata, Acropora sp. and Nematostella sp.) but not in Medusozoa and Myxozoa. Deoxygenation induced an immediate significant down-regulation of most PHD4 orthologs (Figure 4B): out of 20 orthologs, 14 were down-regulated in HvsC, while only two were up-regulated. These results suggest that corals and Nematostealla had expanded their PHD4-like gene repertoire that may function as the main oxygen sensors, being down-regulated under deoxygenation conditions.

Figure 4 Functional and protein-structure conservation of PHD4 gene family in metazoa and cnidaria. (A) Gene tree representation of the PHD4 gene family. This family includes the human PHD4. Left: Metazoan phylogenetic species-tree representing evolution of major species clades. Representative species are symbolled A/S/N/H to denote: Acropora, Stylophora, Nematostella, and human genes; Right: Gene tree representation of the PHD4 gene family in metazoa and fungi, with ~50 metazoa species represented. Leaf colors match the species-tree clade colors. Grey boxes indicate S. pistillata orthologs (Data S6). (B) A heatmap representation of S. pistillata genes HvsC log2 fold changes of PHD4 orthologs in each time-point (values lower than -1 or higher than 1 are color-coded as maximum values). S. pistillata genes have the same order as in the gene tree. Connecting lines in red/green correspond to significantly down/up-regulated genes, respectively. Connecting lines in black correspond to not significant.
The HIF gene family tree is composed of six highly conserved groups, including HIF-α, NPAS, AHR, Clock, HIF-β and ARNTL- like genes (in accordance with (Mills et al., 2018)). S. pistillata genome includes orthologes of all of these key genes (Figure 5A). Orthologous genes of HIF-α, AHR, NPSA, HIF-β and ARNT were significantly up-regulated in deoxygenation, especially in the night time points (Figure 5B). Importantly, the up-regulation of HIF-α at 12 hours subsided at two weeks (Figure S6). The up-regulation of some of the circadian rhythm genes suggests that these genes participate in the response to hypoxia in corals.
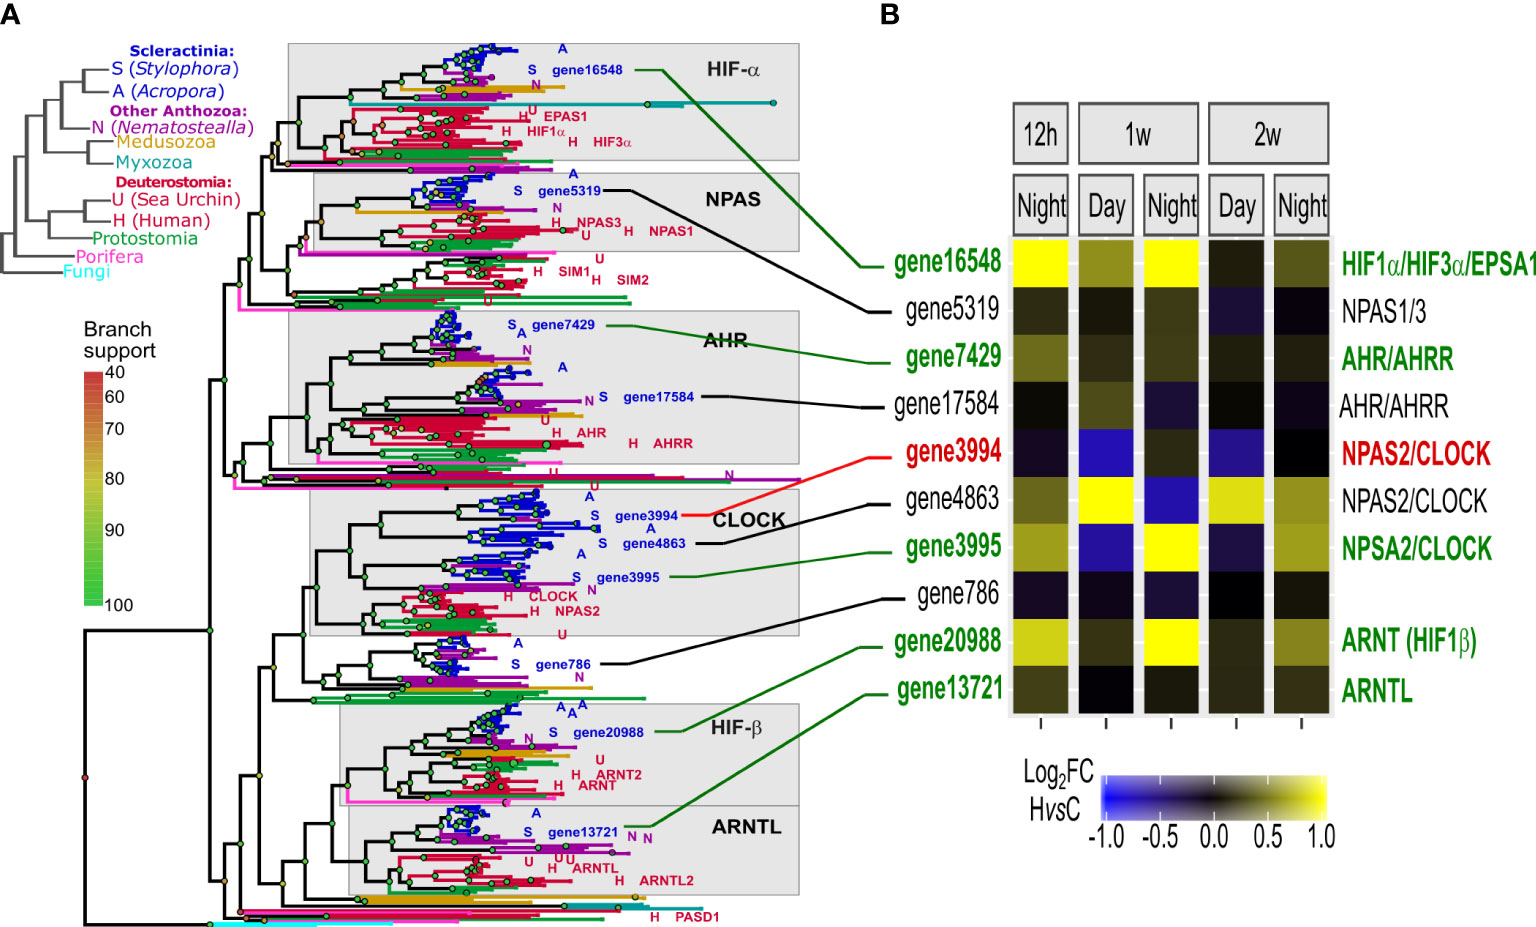
Figure 5 Functional and protein-structure conservation of HIFs in metazoa and cnidaria. (A) Left: Metazoan phylogenetic species-tree representing evolution of major species clades. Representative species are symbolled A/S/N/H to denote: Acropora, Stylophora, Nematostella, and human genes; Right: Gene tree representation of the HIF gene family in metazoa and fungi, with ~50 metazoa species represented. Leaf colors match the species-tree clade colors. Grey boxes represent six conserved groups of humans vs. cnidaria orthologs (Data S3). (B) A heatmap representation of S. pistillata gene HvsC log2 fold changes, in each time point (values lower than -1 or higher than 1 are color-coded as maximum values) (Data S7). S. pistillata genes have the same order as in the gene tree, where Ids in red/green correspond to significantly down/up-regulated genes, respectively. Ids in black correspond to not significant. Connecting lines are colored respectively.
Next, we identified 30 genes that are orthologous to the conserved hypoxia target genes activated by HIF (Figure S7A). Most of these genes show significant up-regulation under deoxygenation conditions, throughout the two weeks (Figure S7B). Taken together these results suggest that the conserved sequential core hypoxia signature, from PHD down-regulation, through HIF up-regulation and the up-regulation of HIF target genes, is conserved and functional in corals, possibly enabling survival under deoxygenation.
Acclimation to deoxygenation includes enhanced expression of starch/glycogen acquisition genes and reduction in the expression of nematocyst formation genes
Increasing mitochondria numbers and biogenesis requires cell membrane components such as sterols while increasing glycolysis requires glycogen and starch sources (Kopp et al., 2015; Hambleton et al., 2019). Our studies reveal an immediate up-regulation of most genes that enhance acquisition of sterols (NPCs) and glycogen (Ppp1r3b and Gbs-76A) from the symbiont at all time points (Figure 6A “symbiosis-derived components”, and Figure 6B (1)-(6)). The enhanced acquisition of carbohydrates is also indicated by the enrichment of up-regulated genes of “starch binding” GO term at all night-time points and at one-week day-time (Figure 6A). Conversely, after two weeks at night, “nematocyst” GO term was enriched with down-regulated genes (Figure 6A). Indeed, a significant down-regulation of the expression of nematogalactin and minicollagen-1, essential for nematocyst formation (Beckmann and Özbek, 2012) is observed at one week, and becomes more prominent over time (Figure 6B (7), (8)), supporting down-regulation of nematocyst formation. Nematocysts are essential for predation, defense and for territorial aggression (Yosef et al., 2020), therefore these results could indicate that prolonged deoxygenation enhance the corals’ dependence on symbiosis-derived components and reduce its predation efforts.
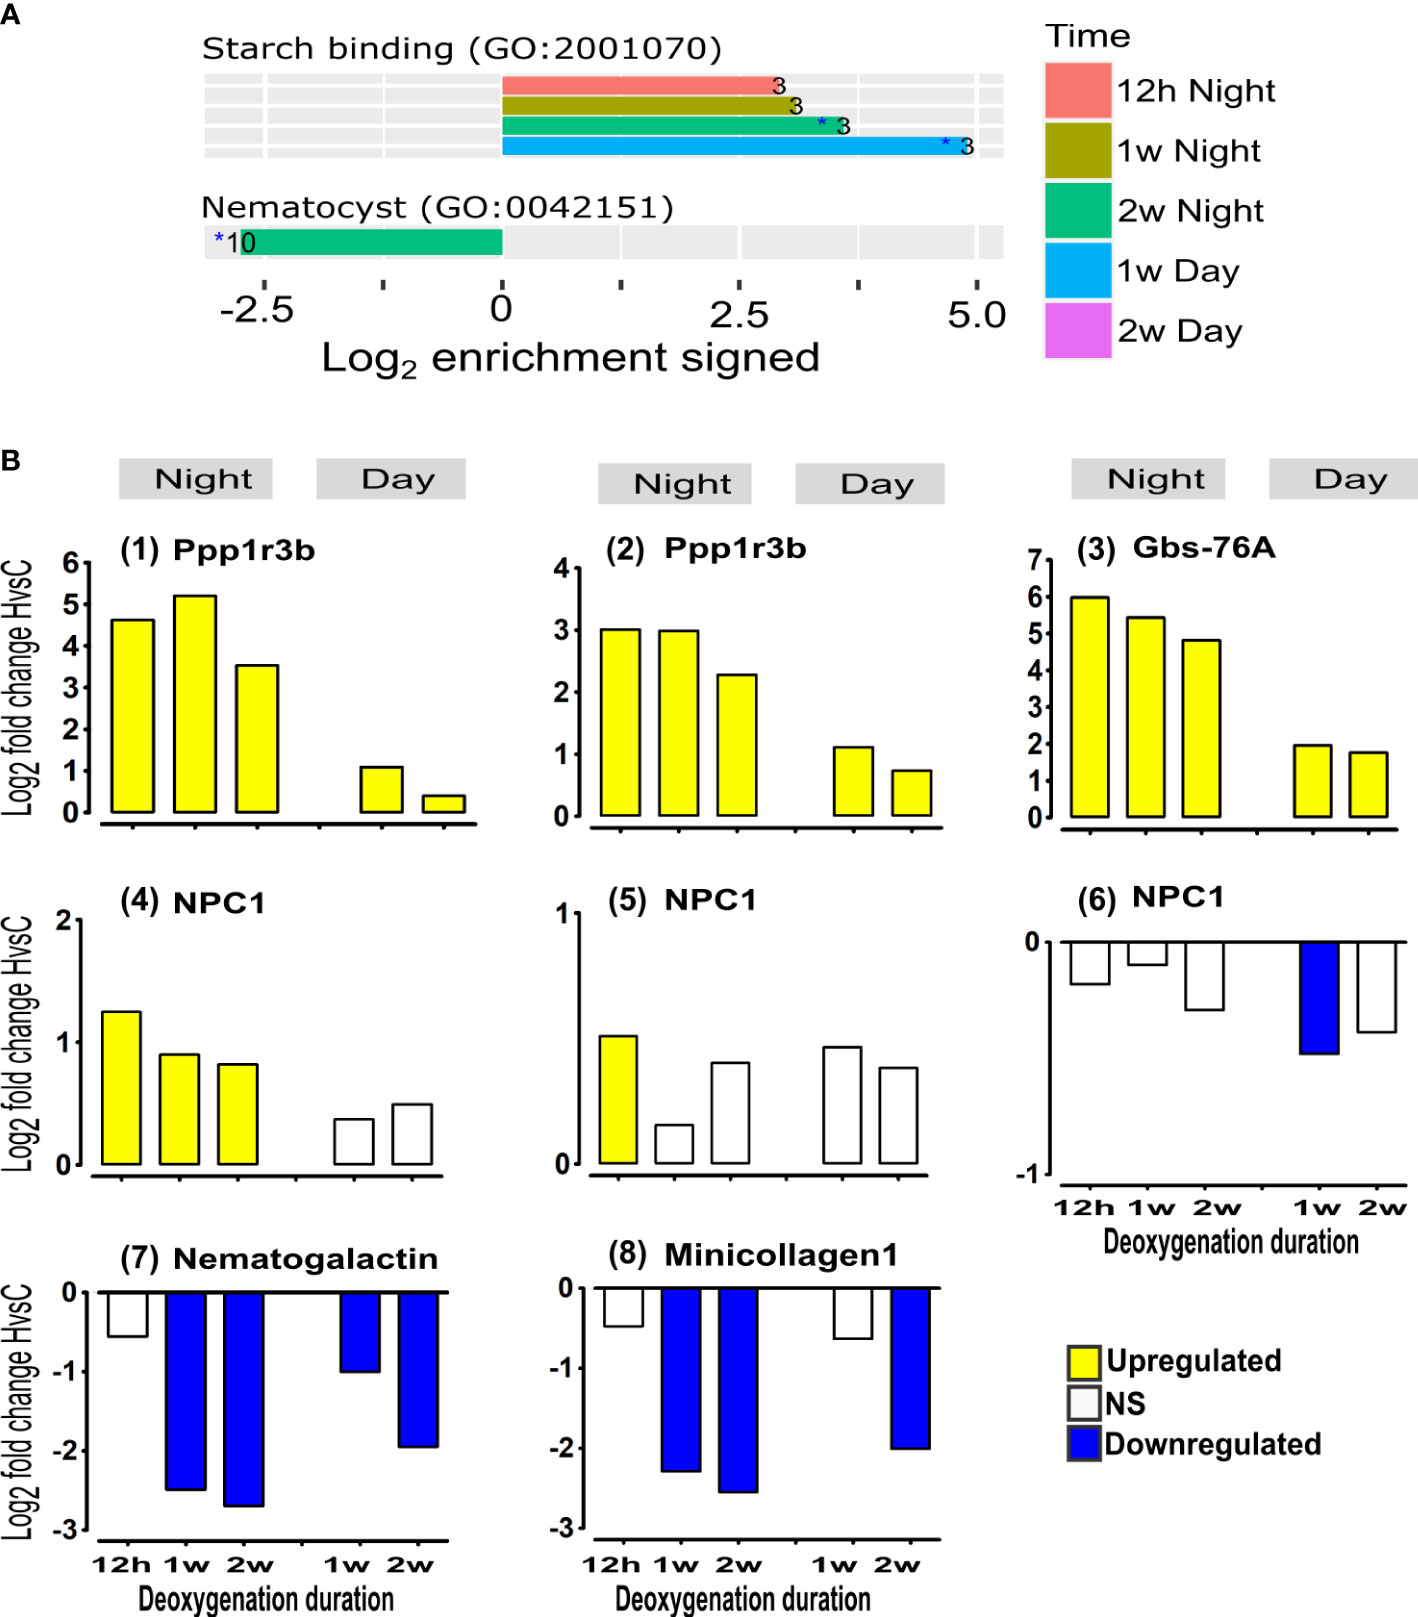
Figure 6 Acclimation to deoxygenation includes enhanced expression of starch/glycogen acquisition genes and reduction in the expression of nematocyst formation genes. (A) Selected functional groups of genes significantly overrepresented among HvsC DE genes. Enrichment log2 fold changes represent the fraction of DE genes in foreground vs. background (see Methods). Positive/negative bars correspond to up/down regulated genes. Only overrepresentations with adjusted p-values<0.05 are shown. Numbers at the bars represent the count of DE genes for the category at the specified time point. (B) Starch/glycogen genes: (1), (2) Protein phosphatase 1 regulatory subunit 3B genes (Ppp1r3b) (Gene9265 and gene9266, respectively); (3) Glycogen-binding subunit 76A (Gbs-76A) (gene9264). Sterol genes: (4),(5),(6) Niemann-Pick C1 genes (NPC1) (gene18538, gene22242 and gene22241, respectively). Nematocyst formation genes: (7) Nematogalactin (gene23685); (8) Minicollagen1 (gene16439). DE (p<0.05) of HvsC response is represented as Log2FoldChange. NS- not significant.
Discussion
Ocean deoxygenation is an acute problem that threatens coral reefs across the world, yet little is known about the ability of corals to persist prolonged deoxygenation and the mechanisms promoting such tolerance. Here we show that S. pistillata can endure severe prolonged deoxygenation without significant physiological responses, possibly due to a significant transcriptional response, as summarized in Figure 7. This transcriptional response to deoxygenation is more significant at night-time, suggesting that oxygen fluctuation due to the symbionts (Kühl et al., 1995), (Linsmayer et al., 2020) results in daytime deoxygenation that is less stressful (Figure 3). We have identified an expansion in oxygen sensing PHDs4 orthologs specifically in Cnidaria containing photosynthetic symbionts (i.e., S. pistillata, Acropora sp. and Nematostella sp.), as compared to other metazoans (Figure 4A). We further demonstrated that in S. pistillata the expression of these genes is down-regulated under deoxygenation (Figure 4B), suggesting that PHDs4 are the main oxygen sensors in these organisms. This expansion could facilitate the quick sensing and response to total variations in oxygen levels resulting from environmental fluctuations as well as switching from photosynthesis to respiration of the symbionts. Our results show immediate up-regulation of HIF-α subsiding at two weeks concomitant with remarkable up-regulation at all time points of PHD3 homolog (Figure S6 and Figure S5B, respectively). In mammalian cells PHD3 is a HIF target gene and its extreme up-regulation creates a direct negative feedback loop on HIF-α (Pescador et al., 2005). This HIF-α “desensitization” is suggested to be necessary for adaptation to chronic hypoxia (Ginouvès et al., 2008). Therefore, S. pistillata PHD3 gene might participate in acclimation to prolonged deoxygenation as well. Moreover, the up-regulation of PHD2 was reported in corals and larvae exposed to short–term, less severe deoxygenation (Alderdice et al., 2021) (Alderdice et al., 2020). Although it was not aligned with significant up-regulation of HIF-α (Alderdice et al., 2021) (Alderdice et al., 2020), taken together these results indicate that PHDs play an important part in the short and long-term response to reduced oxygen levels in corals.
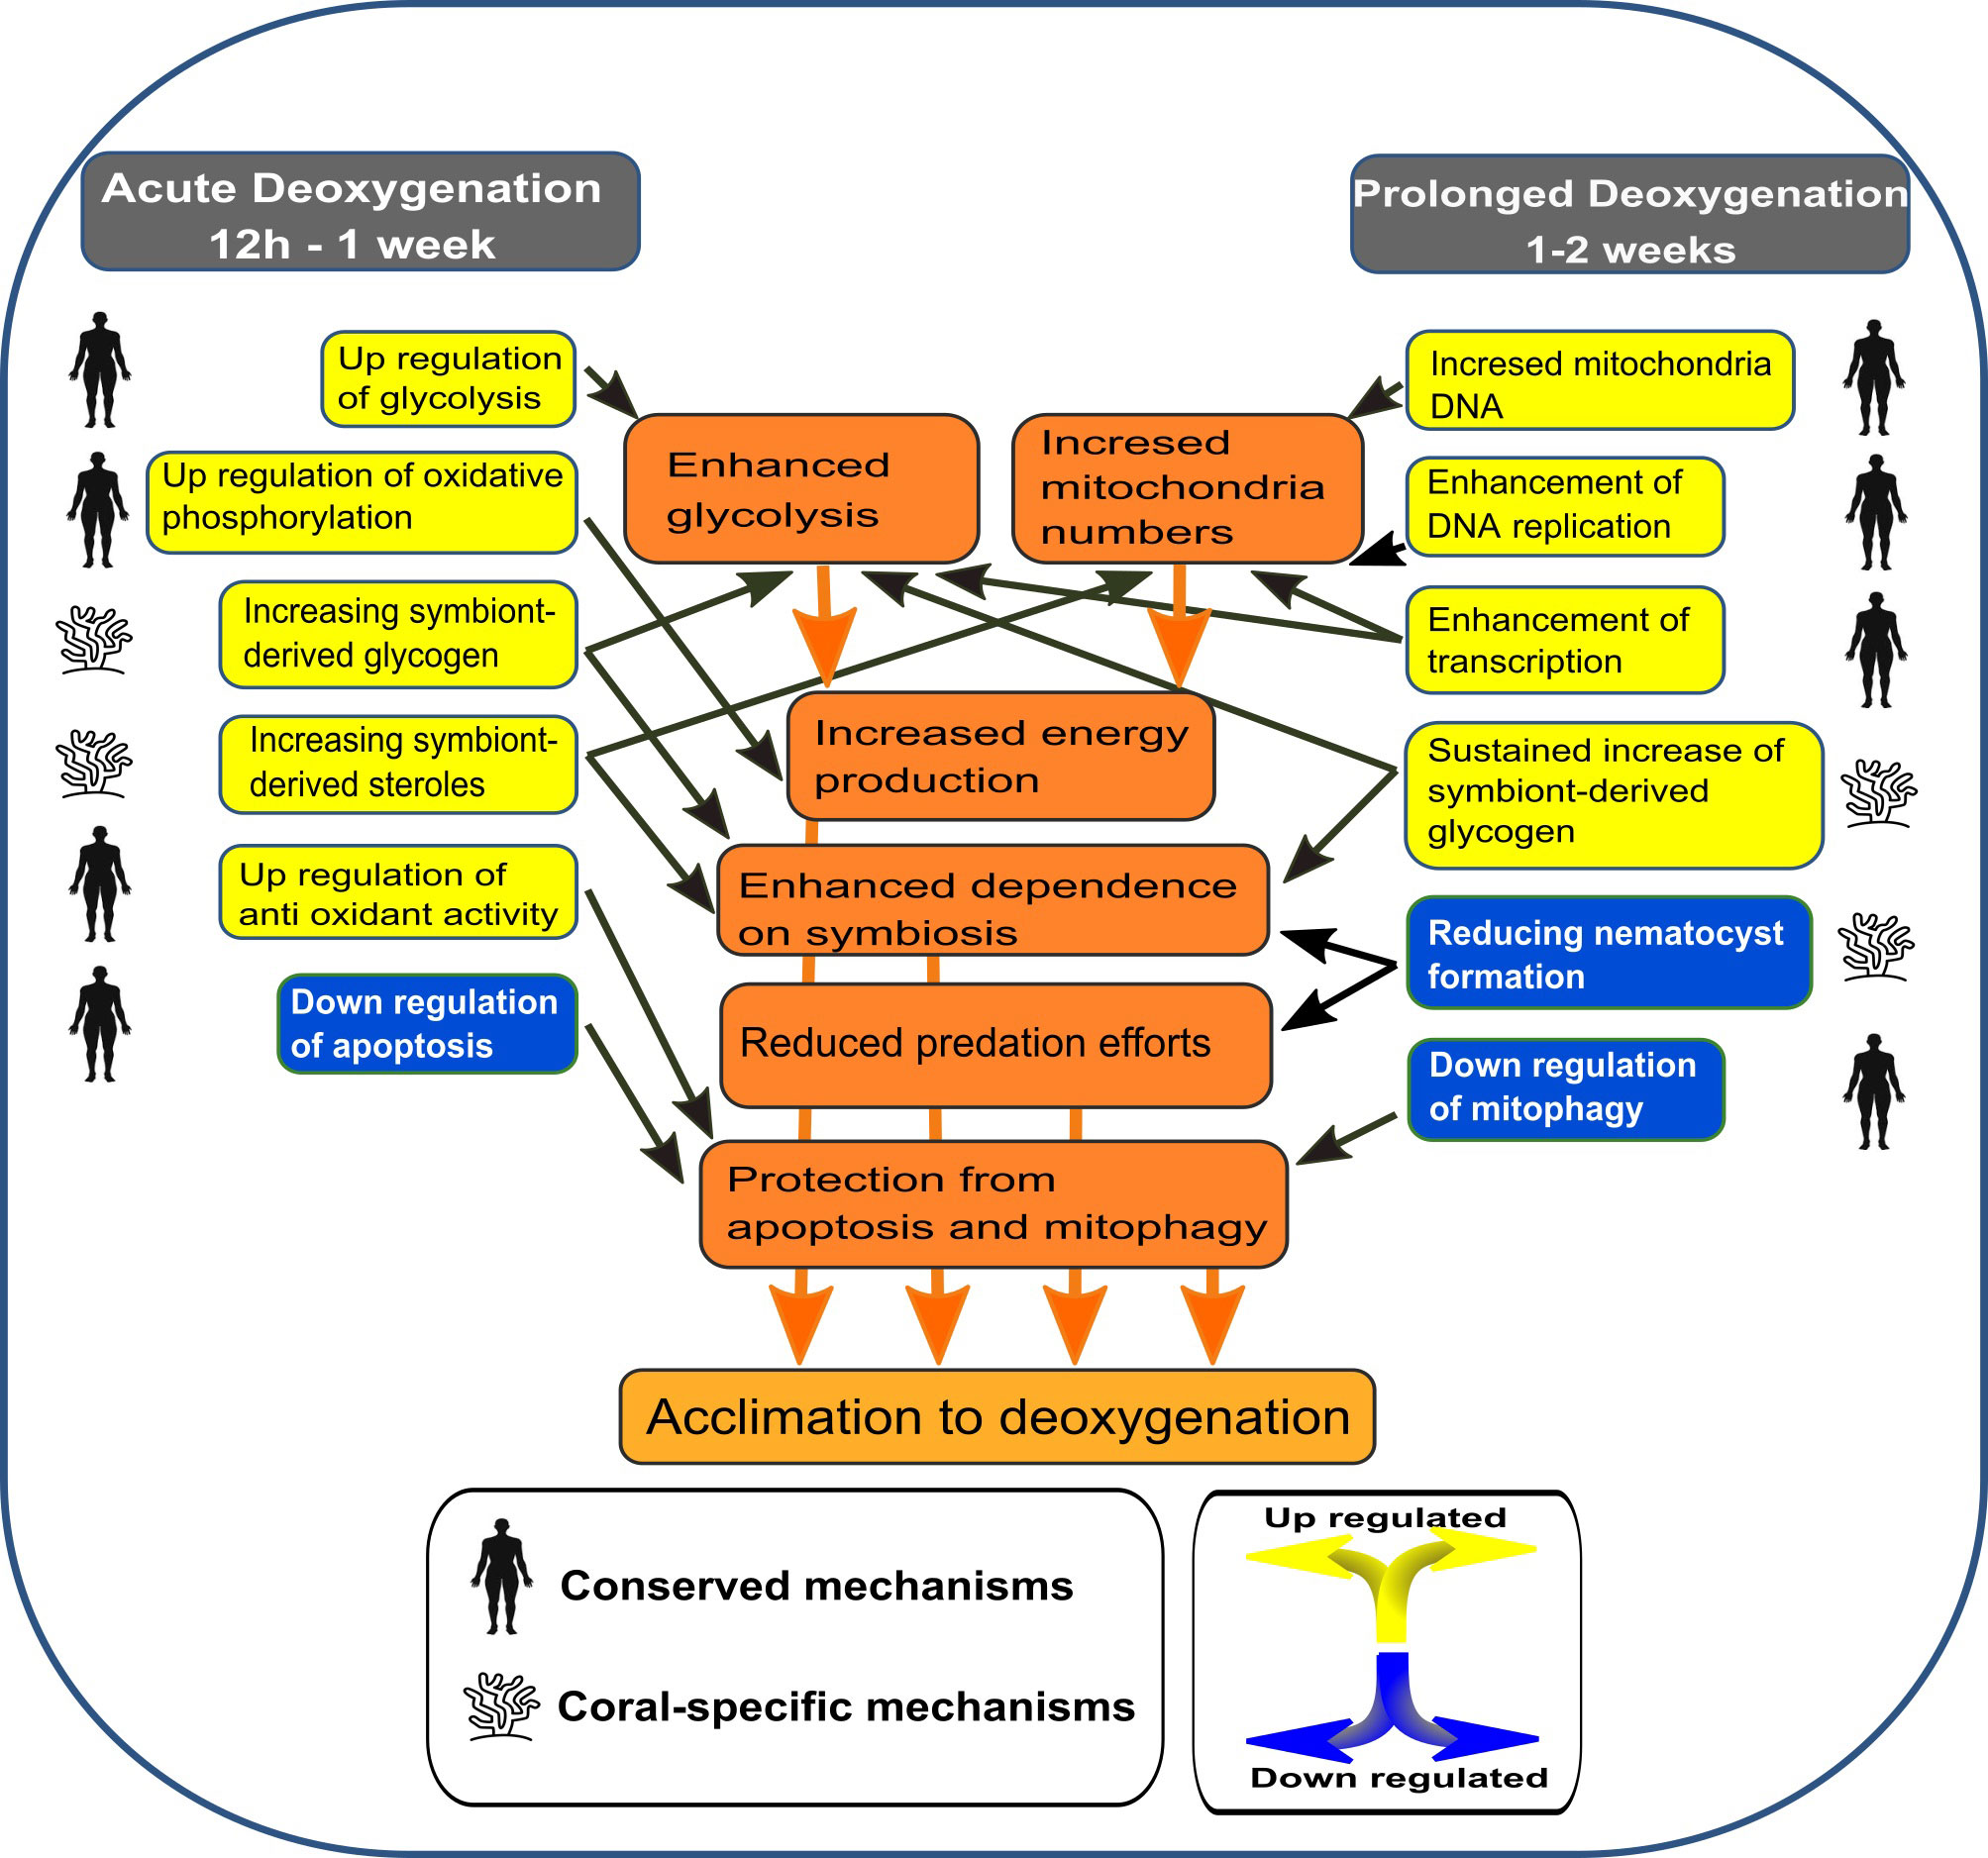
Figure 7 A model suggesting the cellular responses of S. pistillata to acute vs prolonged deoxygenation. The model is based on significantly enriched GO and KEGG terms, on specific DE gene expressions and on relative mitochondria DNA numbers.
The transcriptional response was highly intensive at 12 hours, starting to subside after one week, pointing to a “two stage” model of short-term (12h to one week) vs. prolonged (one to two weeks) response. This model included the same primary mechanisms evoked in mammals in response to hypoxia in addition to coral-specific ones (Figure 7). Accordingly, the coral enhances energy production at acute deoxygenation by immediate up-regulation of glycolysis and oxidative phosphorylation, thus providing a greater mitochondrial metabolic capacity and total energy production. The immediate effect of deoxygenation on the mitochondria is also indicated by the up-regulation of SDHB, which is the only nuclear encoded gene of the succinate dehydrogenase (SDH) complex IV (Figure 3C (4)). This complex connects the ETC to the citrate cycle and is crucial for energy transfer, suggesting that hypoxia enhances the need to generate more ETC complexes, or modulate specific ETC sub-units, similar to the adaptation of mammalian cells (Fuhrmann and Brüne, 2017). At prolonged deoxygenation mitochondria numbers increased while glycolysis subsided. We suggest that by increasing mitochondria numbers, glycolysis per mitochondria can be reduced, without lowering total energy production. Moreover, the down-regulation of mitophagy at prolonged deoxygenation could insure that mitochondria numbers are not reduced. Increasing mitochondria numbers is highly similar to adaptation of mammalian cells to hypoxia, suggested to improve the ability of certain cells to survive a hypoxic stress (Gutsaeva et al., 2008). An increase in glycolysis was also suggested in two Acropora spp. under short–term (12h) and less severe (~2 mg L-1) deoxygenation; however, these corals also displayed gene expression patterns, suggesting mitochondria biogenesis and oxidative phosphorylation were reduced (Alderdice et al., 2020). Mitophagy, determined as the ratio of specific gene expression, varied between time points and species (Alderdice et al., 2020). These results corroborate the differential susceptibility of corals to deoxygenation.
The acclimation to deoxygenation by a reduction in metabolic gene expression appeared to be concomitant with an increase in the number of mitochondria, which suggests that over a prolonged time S. pistillata tends to use cellular metabolic adjustments rather than alter its gene expression (Figure 3D and Table 2). This acclimation aligns with the response of some coral species to natural diurnal hypoxia, exhibiting minor day/night changes in the expression of metabolic genes (Ruiz-Jones and Palumbi, 2015), or in the activity of metabolic enzymes (Linsmayer et al., 2020). Accordingly, some corals appear to regulate energy metabolism through adjustments of cellular/metabolite fluxes rather than use metabolic gene expression alterations to adjust to the diurnal oxygen dial cycle. However, some coral species, like S. pistillata, alter metabolic gene expression in response to short–term deoxygenation or natural diurnal hypoxia (Alderdice et al., 2020; Neder et al., 2022). Therefore, it is hard to predict how corals will acclimate to prolonged deoxygenation based on the response to short-term or natural diurnal hypoxia, emphasizing the importance of our two-week long study.
The enhancement of glycogen/starch up-take from the symbionts during deoxygenation, as suggested in our work, could be essential to withstand and acclimate to deoxygenation (Figure 6). In mammalian cells, enhanced glycogen storage promoted cell survival under hypoxia (Pelletier et al., 2012) whereas in plants, starch storage was essential to withstand prolonged hypoxia and to activate glycolysis (Loreti et al., 2018). In corals under natural diurnal deoxygenation genes involved in glucose and glycogen metabolism were highly up-regulated at noon, as opposed to the total low numbers of genes with differential expression from day to night. A higher expression of these genes during the day suggests a diurnal increase in glycogen storage, possibly creating an energy reserve to be used at night (Ruiz-Jones and Palumbi, 2015). Therefore, symbiosis-derived components such as glycogen might be essential to corals and other organisms that are energetically dependent on photosynthetic symbionts to activate glycolysis and survive hypoxia/deoxygenation. Hence, additional factors (e.g., thermal stress) (Kvitt et al., 2011) leading to coral bleaching might reduce the ability of corals to withstand prolonged deoxygenation. In this line, mechanisms of short-term hypoxia tolerance were suggested to align with thermal stress and bleaching tolerance (Alderdice et al., 2020). Moreover, in a coral (Acropora sp.) exposed to short-term deoxygenation combined with thermal stress, deoxygenation was reported to lower the thermal threshhold of coral bleaching (Alderdice et al., 2022b). Since S. pistillata, reported to be thermally tolerant, bleaches under this stress (Kvitt et al., 2011) but not under hypoxia stress (Figure 1D), the correlation between thermal stress, bleaching and deoxygenation should be investigated in additional coral species.
Overall, our results suggest that acclimation to deoxygenation includes increasing energy production by increasing mitochondria numbers concomitant with higher acquisition of symbiosis derived components. Moreover, the down-regulation of nematocyst formation suggests that energy acquisition via predation is not increased, and might even be decreased. As symbiont population is under control of the host (Xiang et al., 2020), we would have expected acclimation to include an increase in the number of symbionts in addition to higher acquisition of sterol/carbon from the symbionts, thus increasing total symbiosis-derived components availability. Although this trend was observed (Figure 1D), it was not significant. Also, the suggested reduction in nematocyst formation requires more intensive research, to determine its physiological outcome in corals under prolonged deoxygenation.
In mammalian cells, mitochondria are the major players in the hypoxic response, shifting to energy production by glycolysis, but also generating ROS that could promote apoptosis and mitophagy (Blokhina et al., 2003; Lendahl et al., 2009; Fuhrmann and Brüne, 2017). In corals subjected to short-term deoxygenation, a reduction in mitochondrial formation was inferred based on the expression of the POLRMT gene, suggesting reduction in mitochondria numbers as a means of protecting cells from ROS-derived stress under hypoxic conditions. Accordingly, mitochondria are part of the highly conserved hypoxia response in corals as well (Alderdice et al., 2021), (Alderdice et al., 2020). Our results suggest that by up-regulating antioxidant capacity rather than reducing mitochondria numbers S. pistillata protects cells from apoptosis and mitochondria from mitophagy. This is indicated by the enrichment in glutathione transferase activity GO term (Table 1) and the expression of anti-oxidant catalase genes, combined with down-regulation of apoptosis and mitophagy. Accordingly, these responses are essential to withstand acute and prolonged deoxygenation (Figure 3). The importance of enhancing antioxidant capacity to protect the mitochondria under hypoxic conditions has been shown in mammalian cells (Li et al., 2016). Moreover, a constitutively higher antioxidant capacity was shown in diving mammals that experience recurrent hypoxia as compared to non-diving mammals (Hindle, 2020). The importance of controlling apoptosis in order to acclimate to stress conditions has been shown in corals under thermal stress (Kvitt et al., 2011; Tchernov et al., 2011) and reduced pH conditions (Kvitt et al., 2015). In mammalian cells a selection for resistance to hypoxia-induced apoptosis occurred after exposure to repeated periods of hypoxia (Greijer and Van Der Wall, 2004). Therefore, employing higher antioxidant capacity and regulating apoptosis/mitophagy could explain why some coral species are resistant to severe deoxygenation (Altieri et al., 2017).
The up-regulation of DNA repair mechanisms at prolonged deoxygenation suggests that protection of DNA from hypoxic damage is an important mechanism to withstand deoxygenation in S. pistillata. These mechanisms are similar to those observed in the hypoxia-tolerant mole rat, experiencing repeated periods of hypoxia (Domankevich et al., 2018) and are crucial to maintaining genetic stability under hypoxia (Scanlon and Glazer, 2015). In corals subjected to short-term (12h) night-time deoxygenation followed by daytime reoxygenation up-regulation of GADD45 (an indicator of DNA repair) was reported only at reoxygenation, but only in the bleaching susceptible Acropora selago (Alderdice et al., 2020). These results reinforce the important role of DNA damage and repair mechanisms in corals under changing oxygen levels.
Altogether, our results suggest that S. pistillata is an organism that is well adapted to deoxygenation.
By showing that most HIF and circadian rhythm genes are affected by deoxygenation, we can functionally corroborate their predicted evolution from a single gene (Mills et al., 2018), also explaining the current interactions between oxygen levels and the circadian rhythm genes reported in mammals (Peek et al., 2017) (Figure 5). Moreover, the high similarity of the gene repertoire and sequential transcriptional response of S. pistillata to that of mammals (i.e., PHDs down-regulation, HIF-α up-regulation and HIF activation of its target genes; Figure S1) suggests that adaptability to hypoxia is deeply rooted in metazoan evolution, occurring at the end of the Neoproterozoic Oxygenation Event (NOE) (Shields-Zhou and Och, 2011). In this line, we suggest that the rise of phytoplankton during the NOE (Falkowski and Isozaki, 2008) eventually created significant diurnal fluctuations of oxygen levels, imposing the evolutionary drive to link the development of genes responsive to day-night changes and oxygen levels. This hypoxic adaptability, inherited from the last common ancestor that prevailed under low unstable oxygen, could be well-preserved in S. pistillata and probably other corals that experience abrupt diurnal oxygen variation, possibly enabling corals’ survival of mass extinction events (Penn et al., 2018).
Overall, our studies show that by utilizing highly conserved and coral–specific response mechanisms, S. pistillata can acclimate to severe prolonged deoxygenation, and possibly survive under climate change-driven oceanic deoxygenation. Nevertheless, the importance of symbiosis in this acclimation, suggests that environmental perturbations that disrupt this symbiosis might negatively affect the ability of corals to withstand ocean deoxygenation.
Data availability statement
The datasets generated and analysed during the current study are available in the NCBI SRA repository under bioproject accession PRJNA646379, biosamples SAMN15541856 to SAMNA15541885.
Author contributions
HK, TS and DT conceived and designed the study. HK and ES performed the experiments. AM, and ML conducted the bioinformatics and statistical analyses. HK, AM, and ML performed the analyses. HK, AM, SB-Td-L, TM, HR, DG, ML, TS and DT wrote the paper. All authors contributed to the article and approved the submitted version.
Funding
This research was supported by a Joint NSFC-ISF Grant NO. 2246/16 , and by the Kadas Family foundation.
Acknowledgments
The study was performed in accordance with regulations and guidelines set by the Israel Nature and National Park Protection Authority.
Conflict of interest
The authors declare that the research was conducted in the absence of any commercial or financial relationships that could be construed as a potential conflict of interest.
Publisher’s note
All claims expressed in this article are solely those of the authors and do not necessarily represent those of their affiliated organizations, or those of the publisher, the editors and the reviewers. Any product that may be evaluated in this article, or claim that may be made by its manufacturer, is not guaranteed or endorsed by the publisher.
Supplementary material
The Supplementary Material for this article can be found online at: https://www.frontiersin.org/articles/10.3389/fmars.2022.999558/full#supplementary-material
References
Adamovich Y., Ladeuix B., Golik M., Koeners M. P., Asher G. (2017). Rhythmic oxygen levels reset circadian clocks through HIF1α. Cell Metab. 25, 93–101. doi: 10.1016/j.cmet.2016.09.014
Alderdice R., Hume B. C. C., Kühl M., Pernice M., Suggett D. J., Voolstra C. R. (2022a). Disparate inventories of hypoxia gene sets across corals align with inferred environmental resilience. Front. Mar. Sci. 9, 2296–7745. doi: 10.3389/fmars.2022.834332
Alderdice R., Perna G., Cárdenas A., Hume B. C. C., Wolf M., Kühl M., et al. (2022b). Deoxygenation lowers the thermal threshold of coral bleaching. Sci. Rep. 12, 18273. doi: 10.1038/s41598-022-22604-3
Alderdice R., Pernice M., Cárdenas A., Hughes D. J., Harrison P. L., Boulotte N., et al. (2021). Hypoxia as a physiological cue and pathological stress for coral larvae. Mol. Ecol. 31, 571–587. doi: 10.1111/mec.16259
Alderdice R., Suggett D. J., Cárdenas A., Hughes D. J., Kühl M., Pernice M., et al. (2020). Divergent expression of hypoxia response systems under deoxygenation in reef-forming corals aligns with bleaching susceptibility. Glob. Change Biol. 27, 312–326. doi: 10.1111/gcb.15436
Altieri A. H., Harrison S. B., Seemann J., Collin R., Diaz R. J., Knowlton N. (2017). Tropical dead zones and mass mortalities on coral reefs. Proc. Natl. Acad. Sci. 114, 3660–3665. doi: 10.1073/pnas.1621517114
Alva García J. V., Klein S. G., Alamoudi T., Arossa S., Parry A. J., Steckbauer A., et al. (2022). Thresholds of hypoxia of two red Sea coral species (Porites sp. and galaxea fascicularis). Front. Mar. Sci. 9. doi: 10.3389/fmars.2022.945293
Beckmann A., Özbek S. (2012). The nematocyst: a molecular map of the cnidarian stinging organelle. Int. J. Dev. Biol. 56, 577–582. doi: 10.1387/ijdb.113472ab
Blokhina O., Virolainen E., Fagerstedt K. V. (2003). Antioxidants, oxidative damage and oxygen deprivation stress: a review. Ann. Bot. 91, 179–194. doi: 10.1093/aob/mcf118
Bolger A. M., Lohse M., Usadel B. (2014). Trimmomatic: a flexible trimmer for illumina sequence data. Bioinformatics 30, 2114–2120. doi: 10.1093/bioinformatics/btu170
Bryant D. M., Johnson K., Ditommaso T., Tickle T., Couger M. B., Payzin-Dogru D., et al. (2017). A tissue-mapped axolotl de novo transcriptome enables identification of limb regeneration factors. Cell Rep. 18, 762–776. doi: 10.1016/j.celrep.2016.12.063
Buchfink B., Xie C., Huson D. H. (2015). Fast and sensitive protein alignment using DIAMOND. Nat. Methods 12, 59–60. doi: 10.1038/nmeth.3176
Domankevich V., Eddini H., Odeh A., Shams I. (2018). Resistance to DNA damage and enhanced DNA repair capacity in the hypoxia-tolerant blind mole rat Spalax carmeli. J. Expe Biol. 221, jeb174540. doi: 10.1242/jeb.174540
Drake J. L., Malik A., Popovits Y., Yosef O., Shemesh E., Stolarski J., et al. (2021). Physiological and transcriptomic variability indicative of differences in key functions within a single coral colony. Front. Mar. Sci. 8. doi: 10.3389/fmars.2021.685876
Emms D. M., Kelly S. (2015). OrthoFinder: solving fundamental biases in whole genome comparisons dramatically improves orthogroup inference accuracy. Genome Biol. 16, 157. doi: 10.1186/s13059-015-0721-2
Emms D. M., Kelly S. (2019). OrthoFinder: phylogenetic orthology inference for comparative genomics. Genome Biol. 20, 238. doi: 10.1186/s13059-019-1832-y
Falkowski P. G., Isozaki Y. (2008). The story of O2. Science 322, 540–542. doi: 10.1126/science.1162641
Fuhrmann D. C., Brüne B. (2017). Mitochondrial composition and function under the control of hypoxia. Redox Biol. 12, 208–215. doi: 10.1016/j.redox.2017.02.012
Ginouvès A., Ilc K., Macías N., Pouysségur J., Berra E. (2008). PHDs overactivation during chronic hypoxia “desensitizes” HIFα and protects cells from necrosis. Proc. Natl. Acad. Sci. 105, 4745–4750. doi: 10.1073/pnas.0705680105
Greijer A. E., Van Der Wall E. (2004). The role of hypoxia inducible factor 1 (HIF-1) in hypoxia induced apoptosis. J. Clin. Pathol. 57, 1009–1014. doi: 10.1136/jcp.2003.015032
Gutsaeva D. R., Carraway M. S., Suliman H. B., Demchenko I. T., Shitara H., Yonekawa H., et al. (2008). Transient hypoxia stimulates mitochondrial biogenesis in brain subcortex by a neuronal nitric oxide synthase-dependent mechanism. J. Neurosci. 28, 2015–2024. doi: 10.1523/JNEUROSCI.5654-07.2008
Haas A. F., Smith J. E., Thompson M., Deheyn D. D. (2014). Effects of reduced dissolved oxygen concentrations on physiology and fluorescence of hermatypic corals and benthic algae. PeerJ 2, e235. doi: 10.7717/peerj.235
Hambleton E. A., Jones V. A. S., Maegele I., Kvaskoff D., Sachsenheimer T., Guse A. (2019). Sterol transfer by atypical cholesterol-binding NPC2 proteins in coral-algal symbiosis. eLife 8, e43923. doi: 10.7554/eLife.43923.025
Hindle A. G. (2020). Diving deep: understanding the genetic components of hypoxia tolerance in marine mammals. J. App Physiol. 128, 1439–1446. doi: 10.1152/japplphysiol.00846.2019
Hughes D. J., Alderdice R., Cooney C., Kühl M., Pernice M., Voolstra C. R., et al. (2020). Coral reef survival under accelerating ocean deoxygenation. Nat. Clim. Change 10, 296–307. doi: 10.1038/s41558-020-0737-9
Johnson M. D., Scott J. J., Leray M., Lucey N., Bravo L. M. R., Wied W. L., et al. (2021a). Rapid ecosystem-scale consequences of acute deoxygenation on a Caribbean coral reef. Nat. Commun. 12, 4522. doi: 10.1038/s41467-021-24777-3
Johnson M. D., Swaminathan S. D., Nixon E. N., Paul V. J., Altieri A. H. (2021b). Differential susceptibility of reef-building corals to deoxygenation reveals remarkable hypoxia tolerance. Sci. Rep. 11, 23168. doi: 10.1038/s41598-021-01078-9
Keeling R. F., Körtzinger A., Gruber N. (2010). Ocean deoxygenation in a warming world. Ann. Rev. Mar. Sci. 2, 199–229. doi: 10.1146/annurev.marine.010908.163855
Klein S. G., Pitt K. A., Nitschke M. R., Goyen S., Welsh D. T., Suggett D. J., et al. (2017). Symbiodinium mitigate the combined effects of hypoxia and acidification on a noncalcifying cnidarian. Glob Change Biol. 23, 3690–3703. doi: 10.1111/gcb.13718
Kopp C., Domart-Coulon I., Escrig S., Humbel B. M., Hignette M., Meibom A. (2015). Subcellular investigation of photosynthesis-driven carbon assimilation in the symbiotic reef coral Pocillopora damicornis. mBio 6, e02299–e02214. doi: 10.1128/mBio.02299-14
Krief S., Hendy E. J., Fine M., Yam R., Meibom A., Foster G. L., et al. (2010). Physiological and isotopic responses of scleractinian corals to ocean acidification. Geochim Cosmochim Acta 74, 4988–5001. doi: 10.1016/j.gca.2010.05.023
Kühl M., Cohen Y., Dalsgaard T., Jørgensen B. B., Revsbech N. P. (1995). Microenvironment and photosynthesis of zooxanthellae in scleractinian corals studied with microsensors for O2, pH and light. Mar. Ecol. Prog. Ser. 117, 159–172. doi: 10.3354/meps117159
Kvitt H., Kramarsky-Winter E., Maor-Landaw K., Zandbank K., Kushmaro A., Rosenfeld H., et al. (2015). Breakdown of coral colonial form under reduced pH conditions is initiated in polyps and mediated through apoptosis. Proc. Nat. Acad. Sci. 112, 2082–2086. doi: 10.1073/pnas.1419621112
Kvitt H., Rosenfeld H., Tchernov D. (2016). The regulation of thermal stress induced apoptosis in corals reveals high similarities in gene expression and function to higher animals. Sci. Rep. 6, 30359. doi: 10.1038/srep30359
Kvitt H., Rosenfeld H., Zandbank K., Tchernov D. (2011). Regulation of apoptotic pathways by Stylophora pistillata (Anthozoa, pocilloporidae) to survive thermal stress and bleaching. PloS One 6, e28665. doi: 10.1371/journal.pone.0028665
Lendahl U., Lee K. L., Yang H., Poellinger L. (2009). Generating specificity and diversity in the transcriptional response to hypoxia. Nat. Rev. Genet. 10, 821. doi: 10.1038/nrg2665
Levy O., Kaniewska P., Alon S., Eisenberg E., Karako-Lampert S., Bay L. K., et al. (2011). Complex diel cycles of gene expression in coral-algal symbiosis. Science 331, 175–175. doi: 10.1126/science.1196419
Linsmayer L. B., Deheyn D. D., Tomanek L., Tresguerres M. (2020). Dynamic regulation of coral energy metabolism throughout the diel cycle. Sci. Rep. 10, 19881. doi: 10.1038/s41598-020-76828-2
Li P., Zhang D., Shen L., Dong K., Wu M., Ou Z., et al. (2016). Redox homeostasis protects mitochondria through accelerating ROS conversion to enhance hypoxia resistance in cancer cells. Sci. Rep. 6, 22831. doi: 10.1038/srep22831
Loreti E., Valeri M. C., Novi G., Perata P. (2018). Gene regulation and survival under hypoxia requires starch availability and metabolism. Plant Physiol. 176, 1286–1298. doi: 10.1104/pp.17.01002
Love M. I., Huber W., Anders S. (2014). Moderated estimation of fold change and dispersion for RNA-seq data with DESeq2. Genome Biol. 15, 550. doi: 10.1186/s13059-014-0550-8
Malik A., Einbinder S., Martinez S., Tchernov D., Haviv S., Almuly R., et al. (2021). Molecular and skeletal fingerprints of scleractinian coral biomineralization: From the sea surface to mesophotic depths. Acta Biomater 120, 263–276. doi: 10.1016/j.actbio.2020.01.010
Manella G., Aviram R., Bolshette N., Muvkadi S., Golik M., Smith D. F., et al. (2020). Hypoxia induces a time- and tissue-specific response that elicits intertissue circadian clock misalignment. Proc. Nat. Aca Sci. 117, 779–786. doi: 10.1073/pnas.1914112117
Mansouri H., Paige R. L., Surles J. G. (2004). Aligned rank transform techniques for analysis of variance and multiple comparisons. Comm Stat. Theory Methods 33, 2217–2232. doi: 10.1081/STA-200026599
Mills D. B., Francis W. R., Vargas S., Larsen M., Elemans C. P. H., Canfield D. E., et al. (2018). The last common ancestor of animals lacked the HIF pathway and respired in low-oxygen environments. eLife 7, e31176. doi: 10.7554/eLife.31176
Mircea I., William K. G. (2017). The EGLN-HIF O2-sensing system: multiple inputs and feedbacks. Mol. Cell 66, 772–779. doi: 10.1016/j.molcel.2017.06.002
Neder M., Saar R., Malik A., Antler G., Mass T. (2022). New insights on the diurnal mechanism of calcification in the stony coral, Stylophora pistillata. Front. Mar. Sci. 8. doi: 10.3389/fmars.2021.745171
Nguyen L.-T., Schmidt H. A., Von Haeseler A., Minh B. Q. (2014). IQ-TREE: A fast and effective stochastic algorithm for estimating maximum-likelihood phylogenies. Molec Biol. Evolu 32, 268–274. doi: 10.1093/molbev/msu300
Nicklas J. A., Brooks E. M., Hunter T. C., Single R., Branda R. F. (2004). Development of a quantitative PCR (TaqMan) assay for relative mitochondrial DNA copy number and the common mitochondrial DNA deletion in the rat. Environ. Mol. Mutagen 44, 313–320. doi: 10.1002/em.20050
Peek C. B., Levine D. C., Cedernaes J., Taguchi A., Kobayashi Y., Tsai S. J., et al. (2017). Circadian clock interaction with HIF1α mediates oxygenic metabolism and anaerobic glycolysis in skeletal muscle. Cell Metab. 25, 86–92. doi: 10.1016/j.cmet.2016.09.010
Pelletier J., Bellot G., Gounon P., Lacas-Gervais S., Pouysségur J., Mazure N. (2012). Glycogen synthesis is induced in hypoxia by the hypoxia-inducible factor and promotes cancer cell survival. Front. Oncol. 2, 18. doi: 10.3389/fonc.2012.00018
Penn J. L., Deutsch C., Payne J. L., Sperling E. A. (2018). Temperature-dependent hypoxia explains biogeography and severity of end-permian marine mass extinction. Science 362, eaat1327. doi: 10.1126/science.aat1327
Pescador N., Cuevas Y., Naranjo S., Alcaide M., Villar D., Landázuri M. O., et al. (2005). Identification of a functional hypoxia-responsive element that regulates the expression of the egl nine homologue 3 (egln3/phd3) gene. Biochem. J. 390, 189–197. doi: 10.1042/BJ20042121
Ritchie R. J. (2008). Universal chlorophyll equations for estimating chlorophylls a, b, c, and d and total chlorophylls in natural assemblages of photosynthetic organisms using acetone, methanol, or ethanol solvents. Photosynthetica 46, 115–126. doi: 10.1007/s11099-008-0019-7
Roder C., Berumen M. L., Bouwmeester J., Papathanassiou E., Al-Suwailem A., Voolstra C. R. (2013). First biological measurements of deep-sea corals from the red Sea. Sci. Rep. 3, 2802. doi: 10.1038/srep02802
Rozewicki J., Li S., Amada K. M., Standley D. M., Katoh K. (2019). MAFFT-DASH: integrated protein sequence and structural alignment. Nucl. Acids Res. 47, W5–W10. doi: 10.1093/nar/gkz342
Ruiz-Jones L. J., Palumbi S. R. (2015). Transcriptome-wide changes in coral gene expression at noon and midnight under field conditions. Biol. Bull. 228, 227–241. doi: 10.1086/BBLv228n3p227
Scanlon S. E., Glazer P. M. (2015). Multifaceted control of DNA repair pathways by the hypoxic tumor microenvironment. DNA Repair 32, 180–189. doi: 10.1016/j.dnarep.2015.04.030
Schmidtko S., Stramma L., Visbeck M. (2017). Decline in global oceanic oxygen content during the past five decades. Nature 542, 335–339. doi: 10.1038/nature21399
Schneider K., Erez J. (2006). The effect of carbonate chemistry on calcification and photosynthesis in the hermatypic coral Acropora eurystoma. Limnol Oceanogr 51, 1284–1293. doi: 10.4319/lo.2006.51.3.1284
Shaw K. (2008). Environmental cues like hypoxia can trigger gene expression and cancer development. Nat. Educ. 1, 198. Available at: https://www.nature.com/scitable/topicpage/environmental-cues-like-hypoxia-can-trigger-gene-41466/.
Shields-Zhou G., Och L. (2011). The case for a neoproterozoic oxygenation event: geochemical evidence and biological consequences. GSa Today 21, 4–11. doi: 10.1130/GSATG102A.1
Stanley G. ,. D. Jr, Helmle K. ,. P. (2010). Middle Triassic coral growthbands and their implication for photosymbiosis. Palaios 25, 754–763. doi: 10.2110/palo.2010.p10-039r
Subramanian A., Tamayo P., Mootha V. K., Mukherjee S., Ebert B. L., Gillette M. A., et al. (2005). Gene set enrichment analysis: A knowledge-based approach for interpreting genome-wide expression profiles. Proc. Natl. Acad. Sci. U.S.A. 102, 15545–15550. doi: 10.1073/pnas.0506580102
Takahashi J. S. (2017). Transcriptional architecture of the mammalian circadian clock. Nat. Rev. Genet. 18, 164–179. doi: 10.1038/nrg.2016.150
Tchernov D., Kvitt H., Haramaty L., Bibby T. S., Gorbunov M. Y., Rosenfeld H., et al. (2011). Apoptosis and the selective survival of host animals following thermal bleaching in zooxanthellate corals. Proc. Natl. Acad. Sci. U.S.A. 108, 9905–9909. doi: 10.1073/pnas.1106924108
Veal C. J., Carmi M., Fine M., Hoegh-Guldberg O. (2010). Increasing the accuracy of surface area estimation using single wax dipping of coral fragments. Coral Reefs 29, 893–897. doi: 10.1007/s00338-010-0647-9
Voolstra C. R., Li Y., Liew Y. J., Baumgarten S., Zoccola D., Flot J.-F., et al. (2017). Comparative analysis of the genomes of Stylophora pistillata and Acropora digitifera provides evidence for extensive differences between species of corals. Sci Rep. 7, 17583. doi: 10.1038/s41598-017-17484-x
Wang G., Yu Z., Zhen Y., Mi T., Shi Y., Wang J., et al. (2014). Molecular characterisation, evolution and expression of hypoxia-inducible factor in aurelia sp.1. PloS One, 9, e100057. doi: 10.1371/journal.pone.0100057
Xiang T., Lehnert E., Jinkerson R. E., Clowez S., Kim R. G., Denofrio J. C., et al. (2020). Symbiont population control by host-symbiont metabolic interaction in symbiodiniaceae-cnidarian associations. Nat. Commun. 11, 108. doi: 10.1038/s41467-019-13963-z
Yosef O., Popovits Y., Malik A., Ofek-Lalzer M., Mass T., Sher D. (2020). A tentacle for every occasion: comparing the hunting tentacles and sweeper tentacles, used for territorial competition, in the coral Galaxea fascicularis. BMC Genomics 21, 548. doi: 10.1186/s12864-020-06952-w
Zaquin T., Zaslansky P., Pinkas I., Mass T. (2019). Simulating bleaching: Long-term adaptation to the dark reveals phenotypic plasticity of the Mediterranean Sea coral Oculina patagonica. Front. Mar. Sci. 6. doi: 10.3389/fmars.2019.00662
Keywords: hypoxia, cnidaria, circadian rhythm, HIF - Hypoxia inducible factor, ocean deoxygenation, symbiosis, mitochondria, apoptosis
Citation: Kvitt H, Malik A, Ben-Tabou de-Leon S, Shemesh E, Lalzar M, Gruber DF, Rosenfeld H, Shi T, Mass T and Tchernov D (2022) Transcriptional responses indicate acclimation to prolonged deoxygenation in the coral Stylophora pistillata. Front. Mar. Sci. 9:999558. doi: 10.3389/fmars.2022.999558
Received: 21 July 2022; Accepted: 11 November 2022;
Published: 02 December 2022.
Edited by:
Manuel Aranda, King Abdullah University of Science and Technology, Saudi ArabiaReviewed by:
David Suggett, University of Technology Sydney, AustraliaRachel Alderdice, University of Technology Sydney, Australia
Copyright © 2022 Kvitt, Malik, Ben-Tabou de-Leon, Shemesh, Lalzar, Gruber, Rosenfeld, Shi, Mass and Tchernov. This is an open-access article distributed under the terms of the Creative Commons Attribution License (CC BY). The use, distribution or reproduction in other forums is permitted, provided the original author(s) and the copyright owner(s) are credited and that the original publication in this journal is cited, in accordance with accepted academic practice. No use, distribution or reproduction is permitted which does not comply with these terms.
*Correspondence: Dan Tchernov, dtchernov@univ.haifa.ac.il